
Can we find inflation hedges in the stock market?
The answer is yes—at least to some extent.
We find that certain industries, particularly those related to resource equities, have historically offered some protection against high inflation levels. In periods when inflation was largely driven by oil and energy crises, these industries also hedged against rising inflation.
A more robust hedge, however, can be found through a combination of value and momentum factors. This factor portfolio provides consistent protection against high inflation across all tested horizons, ranging from one to five years.
Industries as an inflation hedge
In my previous piece, On inflation and stock returns, we concluded that the stock market is highly sensitive to inflation levels, showing a strong negative association. It is also negatively affected—though to a much lesser extent—by rising inflation. In other words, the stock market, or the market factor, does not serve as an inflation hedge.
There are structural inflation hedges, such as inflation-linked bonds, and asset classes like commodities, which are known to perform well when inflation is high. But can we find inflation hedges within the stock market? While the market itself isn’t a hedge, perhaps certain stock market industries are.
We will show that some industries have historically offered protection against inflation—particularly when their market exposure is hedged.
As in my previous piece, we utilize U.S. inflation data by Robert Shiller [1], starting after the end of the traditional gold standard (Gold Reserve Act of 1934). Our dataset spans from Q1 1934 to Q3 2024. Industry and stock market return data are sourced from the Kenneth French Data Library [2]. We use monthly return data for 49 industries and examine 1-year, 3-year, and 5-year returns. Link to industry definitions can be found from here. Most—though not all—industries have return data for the full period. We always use the maximum available data for each industry. We use nominal returns, meaning that an inflation level beta of one implies that the return series is indifferent to the inflation level and preserves purchasing power. All returns and inflation are expressed in continuously compounded (log-return) format.
Similar to our previous piece, we use overlapping quarterly rolling data to estimate betas, and assess statistical significance using the median t-statistic calculated from non-overlapping samples with all possible starting quarters. Statistical significance at the 5% level is determined when the absolute value of the median t-statistic across all starting points exceeds 1.96.
We first apply a two-factor model where the industry return is the dependent variable, and the two independent variables are the inflation level (or inflation rate) and the change in the inflation level (or inflation rate change). Inflation level is the annualized inflation rate during the period while inflation rate change is measured as the percentage point change in the yearly inflation level, calculated as the difference between the inflation level of the ending year of the period and the inflation level of the year preceding the start of the period.
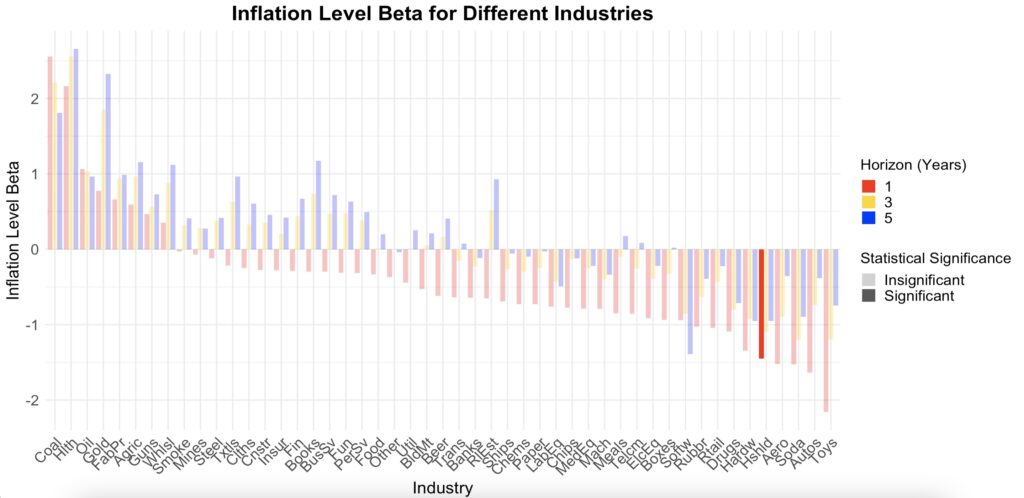
The figure below shows the inflation level sensitivity (beta) for each industry, sorted from the highest 1-year return beta to the lowest. In addition to the 1-year beta, we also display the sensitivities for 3-year and 5-year periods. Coal emerges as the industry that provides the best protection against high inflation levels, followed by Healthcare (Hlth), Petroleum and Natural Gas (Oil), Precious Metals (Gold), and Fabricated Products (FabPr). On the other hand, Recreation (Toys) performs the worst, followed by Automobiles and Trucks (Autos), Candy & Soda (Soda), Aircraft (Aero), and Consumer Goods (Hshld). Notably, of the 49 industries, Consumer Goods is the only one with statistically significant inflation level sensitivity at the 1-year horizon.
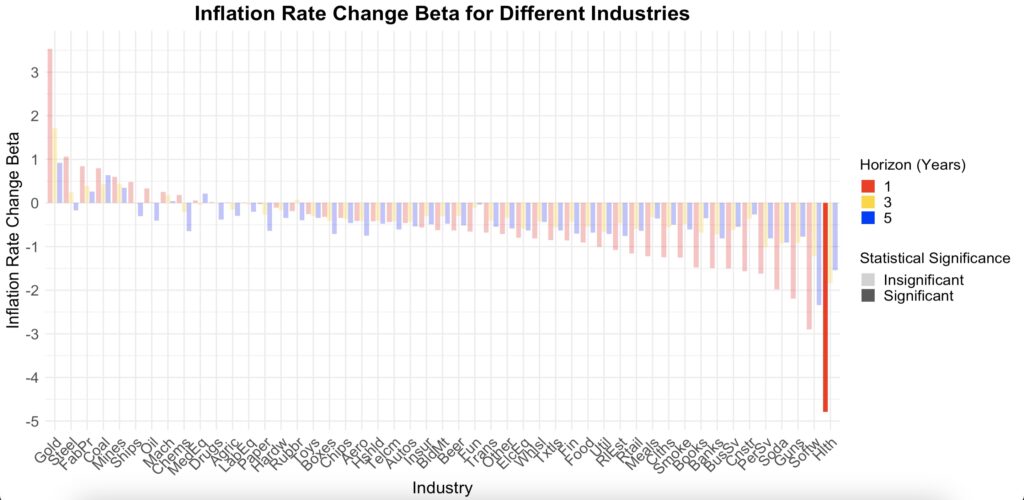
The next figure shows sensitivity to inflation rate change. Historically, Precious Metals (Gold) has been the standout performer, on average faring exceptionally well in a rising inflation environment. On average, a one percentage point increase in the inflation level during a one-year period has corresponded to about a 3.5 percentage point increase in Precious Metals returns (beta = 3.5). On the other end of the spectrum, we observe even more dramatic sensitivity. Healthcare, which provided strong protection against high inflation levels (beta ≈ 2.2), has a negative beta of about -4.8 for inflation rate change. Computer Software (Softw) is also highly sensitive (beta ≈ -2.9) and negatively correlated with rising inflation. However, once again, only one beta—Healthcare at the 1-year horizon—is statistically significant in our data.
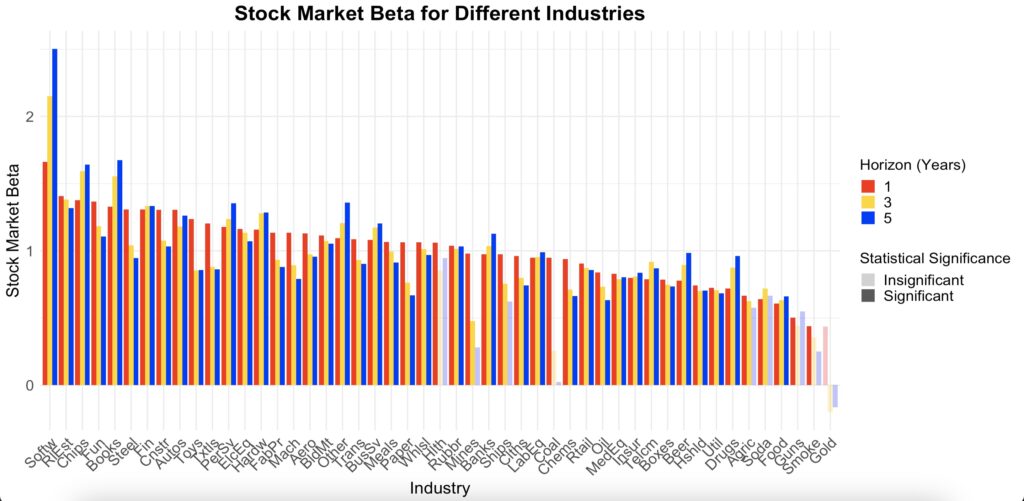
All industries are exposed to the market factor, which, as we know, is highly sensitive and negatively associated with inflation. We therefore include market returns as the third independent variable in our regression model. The figure below shows the market sensitivity for each industry, extracted from our three-factor model. Most of the market betas are statistically significant across all tested horizons. Computer Software (Softw) has the highest market sensitivity by far, and interestingly, this sensitivity increases as we extend the time horizon. On the other hand, some betas decrease and even turn negative as the time horizon increases. Examples of this include Non-Metallic and Industrial Metal Mining (Mines), Coal (Coal), and Precious Metals (Gold). As we discussed in our earlier article, Correlations for the long run, a decreasing market beta over time has been a typical characteristic for many resource equities.
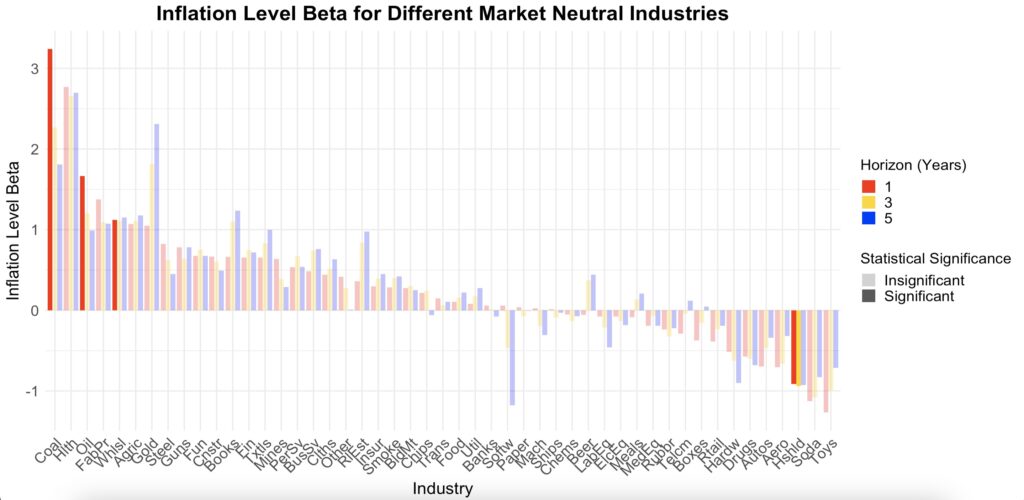
The next figure shows the inflation level sensitivity from our three-factor model, after accounting for inflation rate change and market sensitivity. This represents the pure industry return sensitivity to inflation levels. Coal (Coal) maintains its position at the top, with the 1-year return beta now being statistically significant. Additionally, both 1-year Petroleum and Natural Gas (Oil) and Wholesale (Whlsl) industry returns are statistically significant as inflation hedges.
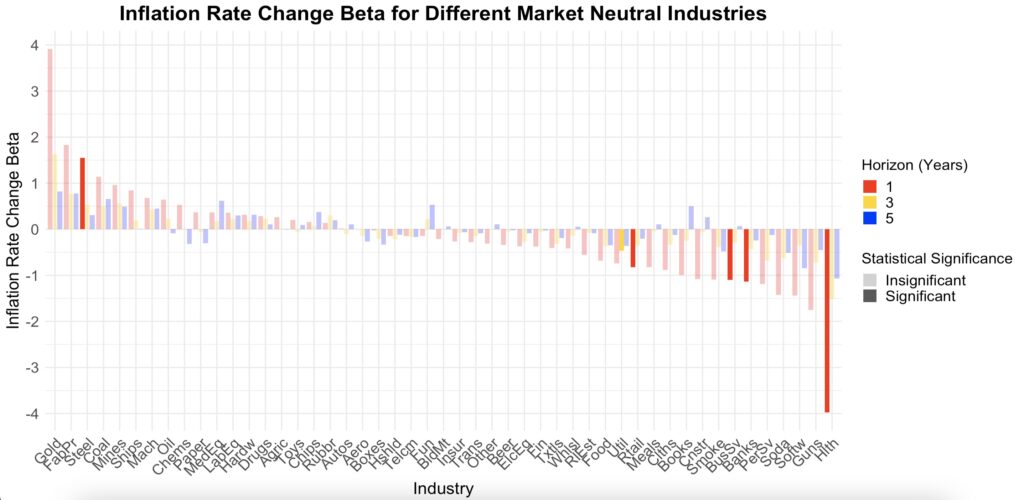
After accounting for inflation level and market sensitivity, the Steel Works Etc (Steel) industry returns at the 1-year horizon become a statistically significant hedge against rising inflation. This can be seen in the next figure.
Portfolio of best inflation hedging industries
We have identified several industries that have historically, on average, acted as a hedge against both high inflation and rising inflation. However, most of these industry-level hedges are not statistically significant.
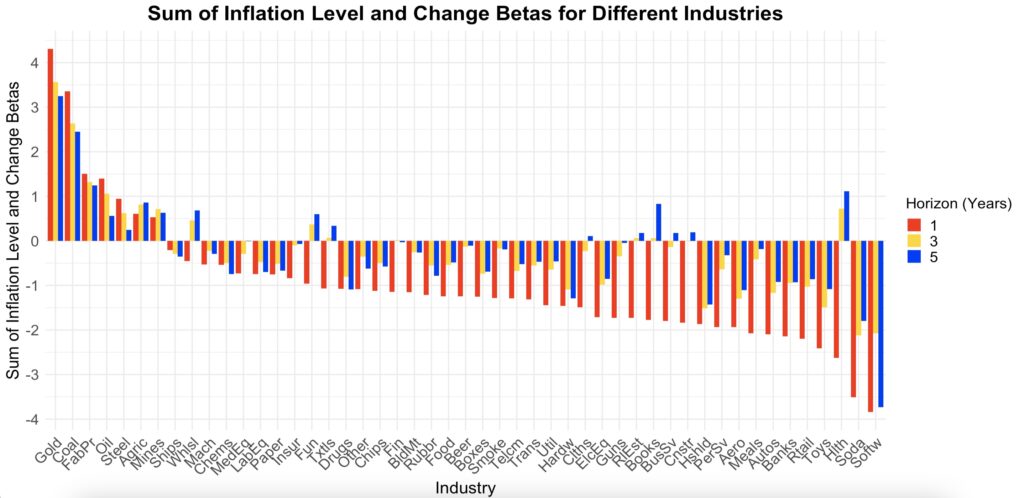
What about a portfolio of industries that have historically hedged against inflation level, rising inflation, or preferably both? By summing the inflation level and inflation rate change betas for each industry, we can determine which industries provide the best combined hedge and then create a portfolio from them.
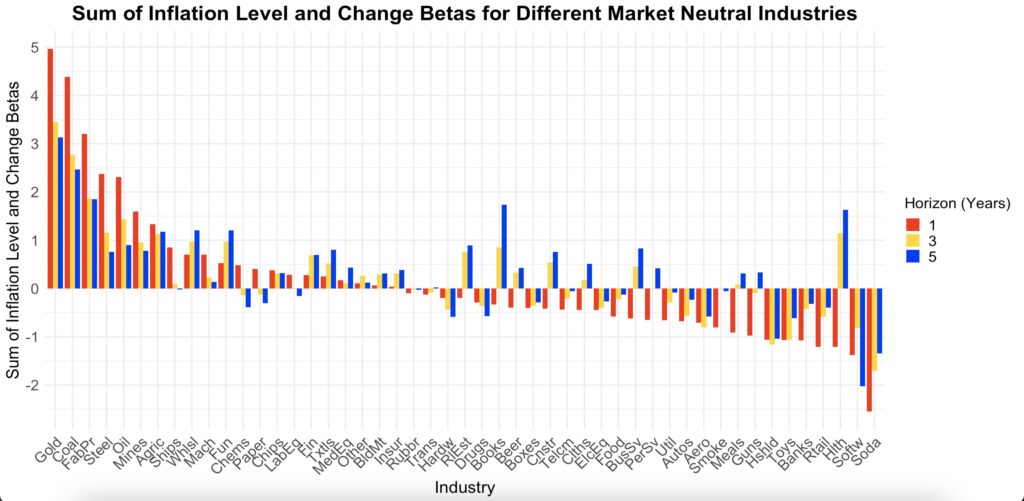
The next figure displays the sum of these two betas. We select the industries where the sum of the inflation level and inflation level change betas is greater than zero. There are seven such industries. Note that this analysis uses the two-factor model, meaning the betas have not been adjusted for market sensitivity. However, the subsequent figure, which incorporates market sensitivity adjustments (using the three-factor model), shows that the same seven industries remain at the top.
The same figure as before, but now the betas have been extracted from the three-factor model, which adjusts for market sensitivity.
Based on the two figures above, we select the seven best industries to form an inflation hedge portfolio. The selected industries are: Precious Metals (Gold), Coal (Coal), Fabricated Products (FabPr), Petroleum and Natural Gas (Oil), Steel Works Etc (Steel), Agriculture (Agric), and Non-Metallic and Industrial Metal Mining (Mines). The portfolio is equally weighted and rebalanced monthly.
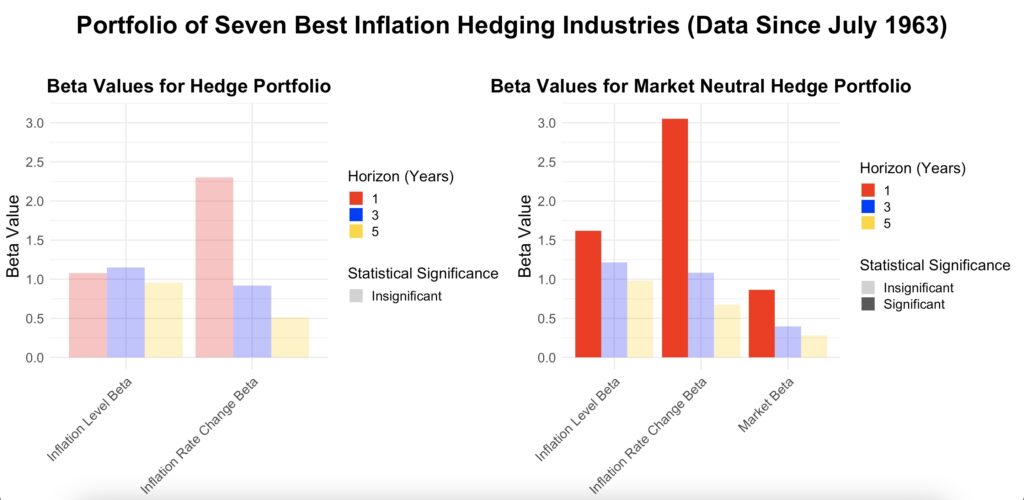
The next figure shows the results for the portfolio. While there is some inflation level and inflation level change hedging, none of the betas are statistically significant when market exposure is not hedged. However, in the market-neutral part of the figure, when market sensitivity is hedged, our portfolio becomes a statistically significant inflation level hedge at the 1-year horizon. The inflation level change hedge remains statistically insignificant. Additionally, we observe that the market sensitivity of our resource equity-heavy portfolio decreases as the time horizon lengthens.

The best (Precious Metals) and the third-best (Fabricated Products) inflation-hedging assets in our portfolio don’t have data for the entire period we are testing. Their data starts from July 1963. Therefore, we present the results below for the period from Q3 1963 to Q3 2024. When market exposure is hedged, our portfolio acts as a highly effective hedge against both inflation level (beta around 1.6) and, particularly, rising inflation (beta around 3.0). Both of these betas are now statistically significant for 1-year returns.
On the other hand, when starting the analysis from 1963, the oil and energy crisis of the 1970s becomes the dominant inflation-related event in the data. Additionally, the U.S. fully abandoned the gold standard in the early 1970s, a period that coincided with high inflation. It is therefore not entirely surprising that our resource equity-heavy portfolio performs well under these conditions.
Factors as an inflation hedge
What about equity factors—can they hedge against inflation? It turns out, yes—a portfolio of factors can provide protection against inflation.
We select several well-known factors from the Kenneth French data library [2] and from AQR Data Sets [3]. The factors from AQR are all labeled with “_AQR” at the end of their names. The remaining factors are from the Kenneth French Data Library. Specifically, HML represents the value factor, Mom and UMD represent momentum, SMB is for size, CMA for investment, RMW for profitability, QMJ for quality, and BAB for the low beta factor.
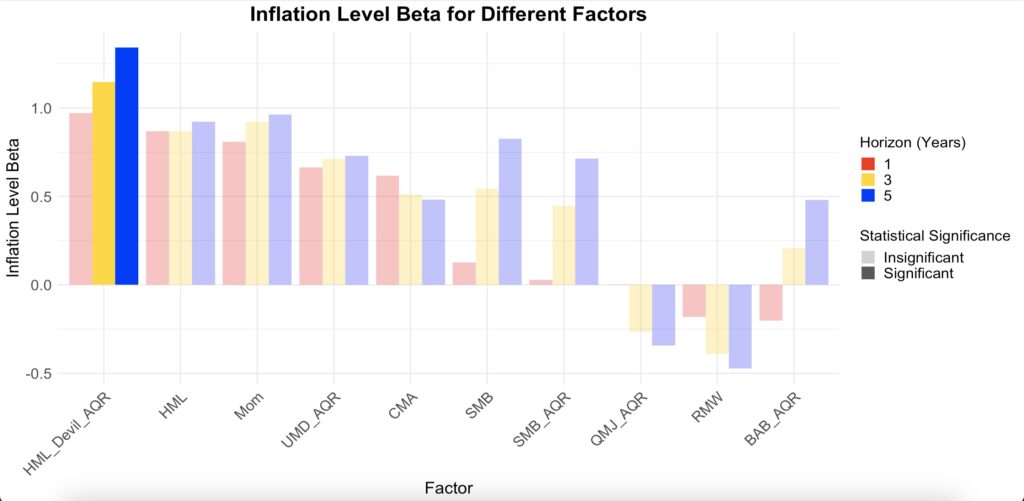
The figure below uses a two-factor model (inflation level and inflation level change as independent variables). We observe that the value and momentum factors have relatively high and positive betas, while the quality and profitability factors show mildly negative betas. The size factor appears to become a fairly good inflation hedge at longer horizons. The value factor from AQR is statistically significant at the longer (3- and 5-year) horizons.
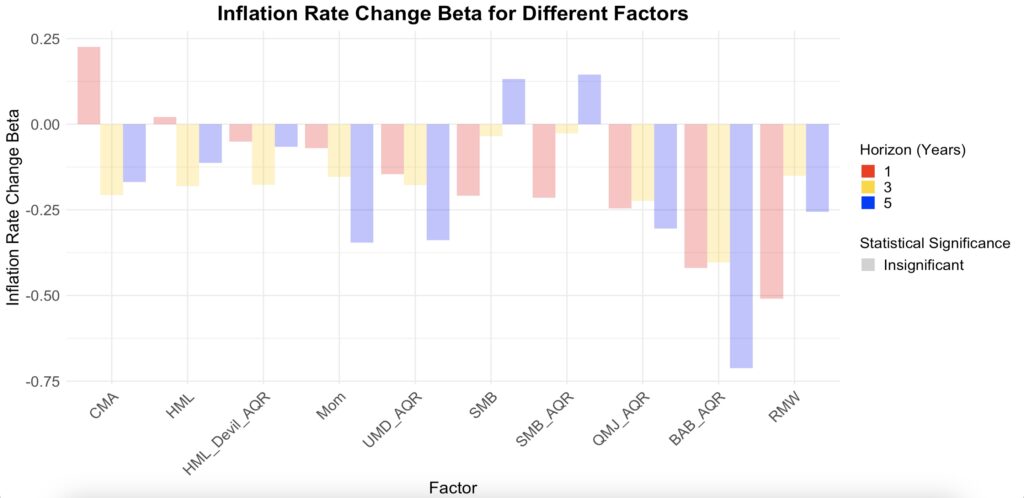
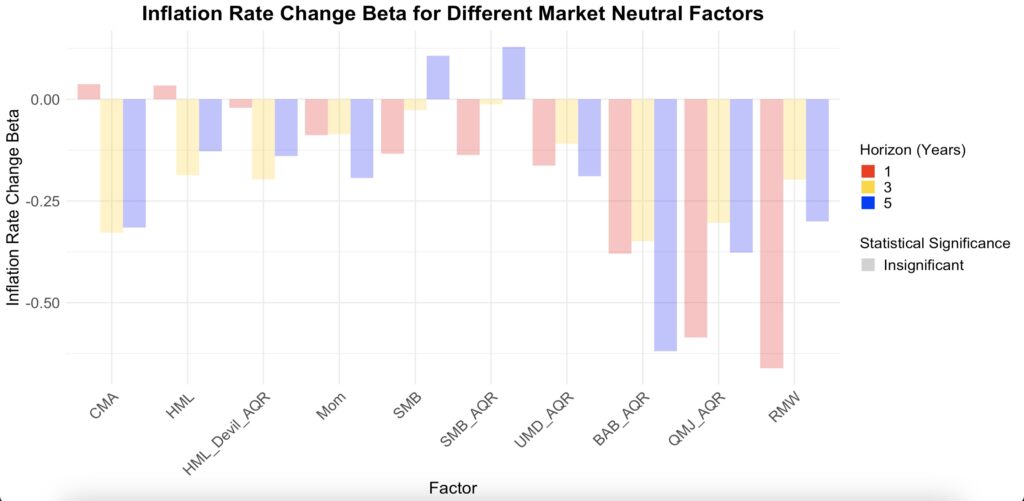
The next figure shows the sensitivity to changes in inflation level. Equity factors don’t seem to be very sensitive to changes in inflation, but the quality, profitability, and low beta factors do appear to be negatively impacted by rising inflation.
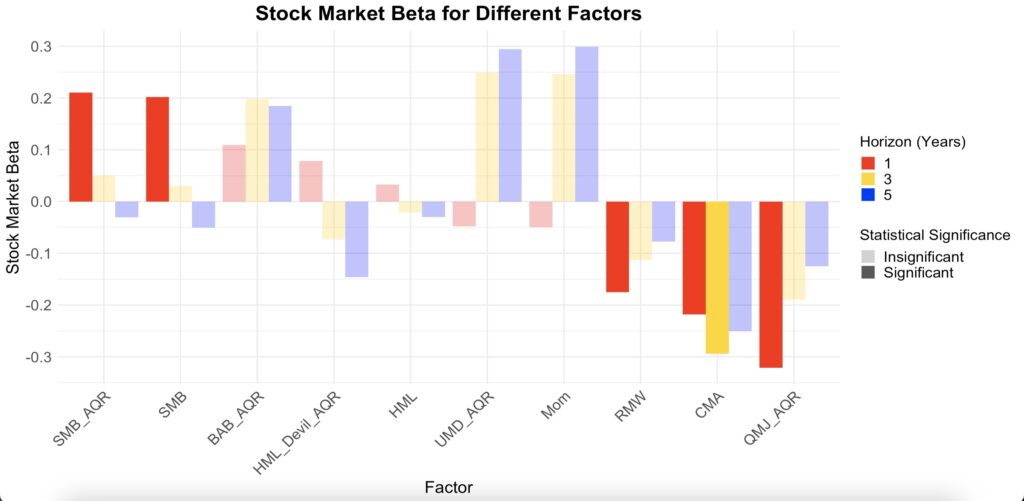
The figure below shows the market sensitivity for each industry, extracted from our three-factor model. Most of the factors appear to be fairly market-neutral (as expected due to the long-short implementation), though there are a few exceptions.
Firstly, the size factor exhibits a statistically significant stock market beta at the one-year horizon. It is known that small, illiquid firms display delayed exposure to market movements (see, e.g., There Is No Size Effect: Daily Edition by Asness [4]), which may help explain why annual returns show a meaningful and statistically significant positive market exposure, whereas daily returns do not. In other words, the small-cap premium can largely be attributed to hidden market risk exposure that only becomes apparent at sufficiently long horizons.
Interestingly, the profitability, quality, and investment factors exhibit statistically significant negative market betas at the one-year horizon. The investment factor also shows significance at the three-year horizon.
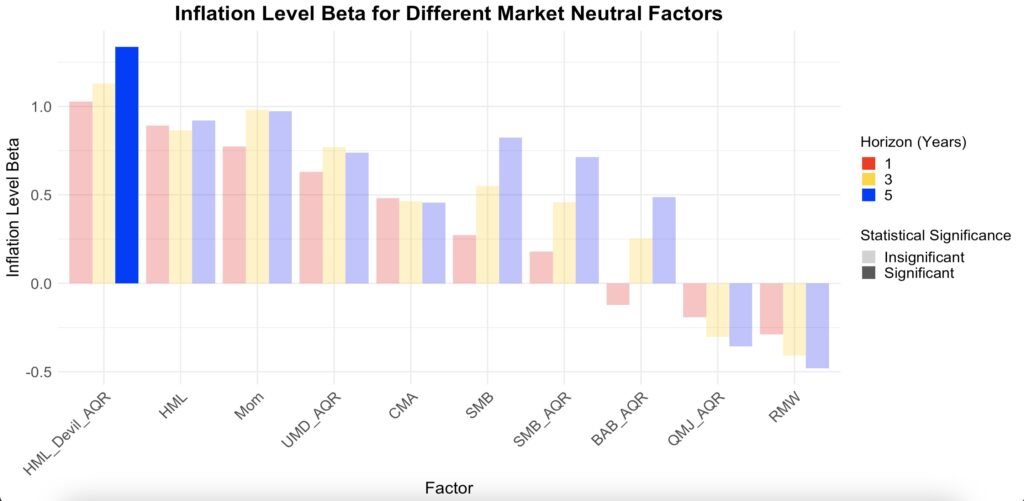
Removing the market exposure does not change the overall picture. The inflation level beta from three-factor model in the figure below is quite similar to the two-factor model figure where market exposure was not removed.
The same applies to the inflation level change sensitivity figure. Removing market exposure does not alter the overall picture.
Portfolio of best inflation hedging factors
The two most effective factors for hedging inflation are clearly the value and momentum factors. The investment factor also appears to be useful, but since it is highly correlated with the value factor, we exclude it. The size factor shows some protection against inflation in the long term, but not at the 1-year horizon, so it is also excluded. We have two versions of both the value and momentum factors: Fama-French (from Kenneth French data) and AQR versions. We opt for the AQR factors because their value factor has a better (or more real-time) implementation. Our factor portfolio is equally weighted and rebalanced monthly, consisting of the value (HML Devil) and momentum (UMD) factors, both of which have data available for the entire period.
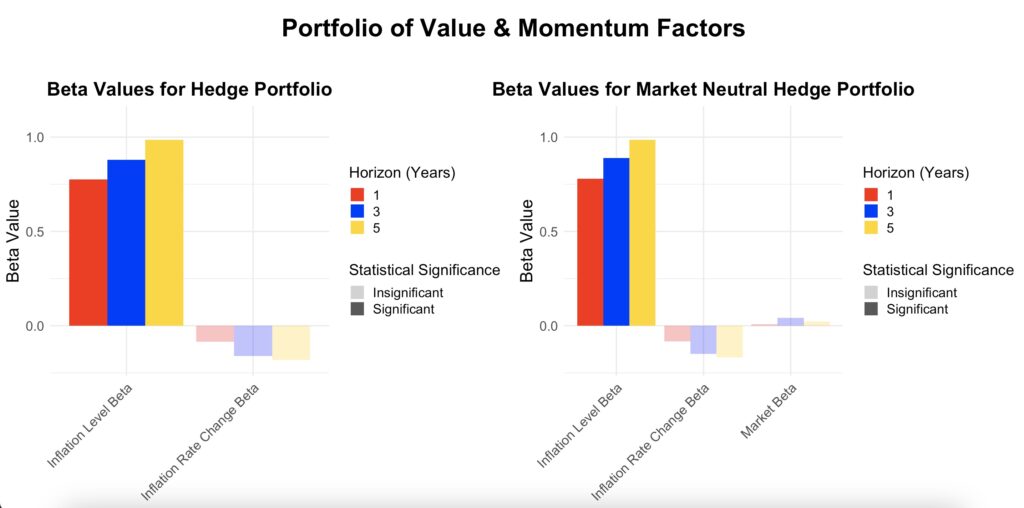
The figure below demonstrates that our value and momentum portfolio provides statistically significant protection against inflation level across all tested horizons. The median t-statistics (calculated from all possible timings for non-overlapping data) for the inflation level beta in our three-factor model are 3.23, 3.04, and 2.94 for the 1-, 3-, and 5-year horizons, respectively. In fact, all non-overlapping data timings show statistical significance at the 1% level for the 1- and 3-year horizons, while the 5-year horizon is always significant at the 5% level. Both the inflation level change and market betas are negligible. At a 5-year horizon, the returns of our factor portfolio increase on average one-to-one with the inflation level.
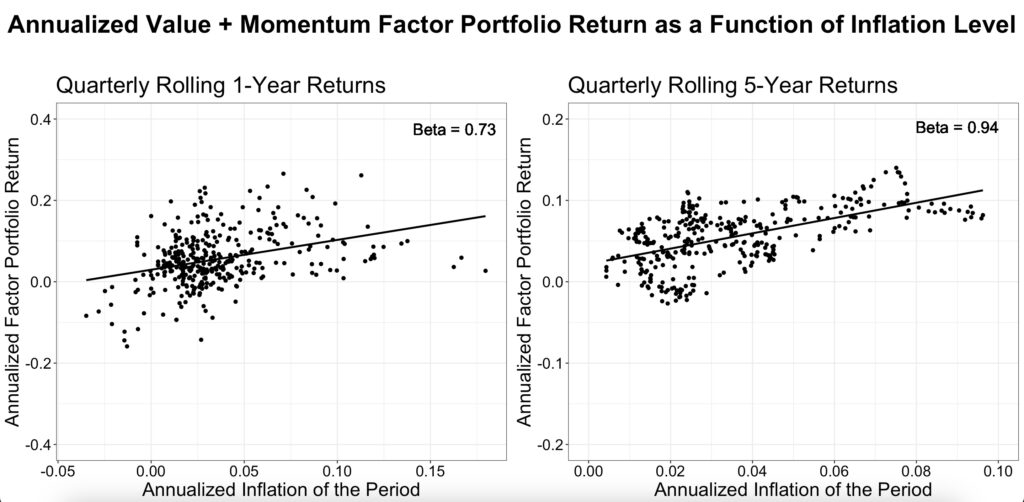
Since two out of the three betas (inflation level change and market) in our model are negligible, a one-factor model (with inflation level as the only independent variable) will sufficiently describe inflation sensitivity. The figure below visualizes this one-factor model. The betas are only slightly different (0.73 vs. 0.77 and 0.94 vs. 0.98) compared to our three-factor model. Historically, the value and momentum portfolio has never experienced a negative 1-year return when inflation level has been greater than 5%, nor a negative 5-year return when inflation level has exceeded 3%.
Conclusions
While the stock market as a whole is not an inflation hedge, certain industries or equity factors can provide protection against inflation.
A resource equity-heavy industry portfolio—including Precious Metals, Coal, Fabricated Products, Petroleum and Natural Gas, Steel Works, Agriculture, and Non-Metallic and Industrial Metal Mining—has historically provided protection against high inflation levels. Using data starting from July 1963 instead of January 1934 allows for full-period coverage across all seven industries. However, this shorter timeframe places greater emphasis on the oil and energy crisis of the 1970s, which becomes the dominant inflationary event in the data. Additionally, the U.S. fully abandoned the gold standard in the early 1970s, coinciding with the surge in inflation. During this period, the industry portfolio effectively hedged against both high inflation levels and, in particular, rising inflation. These results apply to market-neutral industries. Industries without market sensitivity hedging exhibit market risk exposure, which reduces their inflation-hedging effectiveness.
Value and momentum factors have provided protection against high inflation levels, but not against rising inflation. Additionally, the size factor seems to have offered some protection at longer horizons. On the other hand, profitability and quality factors, as well as the low beta factor to some extent, have underperformed during periods of high and rising inflation.
An equally weighted portfolio of value and momentum factors has provided statistically significant protection against high inflation across 1-, 3-, and 5-year horizons, with the inflation level beta approaching one.
Anecdotally, for a long-only stock picker, the worst possible investment in a high—and potentially rising—inflation environment is a large-cap (low SMB), highly profitable (high RMW), high-quality (high QMJ) software company—operating in an industry with high market beta and strong sensitivity to inflation changes—trading at relatively high multiples (low HML) and having recently gotten cheaper relative to other stocks (low UMD). In contrast, the best investment may be a portfolio of small-cap (high SMB), low market beta firms with a resource equity tilt (positive sensitivity to both inflation level and inflation change), trading at relatively low valuations (high HML) and showing recent momentum (high UMD).
References
[1] Robert Shiller Online Data
[2] Kenneth French Data Library
[3] AQR Data Sets
[4] Cliff Asness (2020) There Is No Size Effect: Daily Edition
Article by Markku Kurtti
Pingback: Weekend Reading - Vanguard's Guide To Selecting An ETF Manager & 14 Destinations Where Retirees Thrive Abroad
Pingback: Weekend Reading - Vanguard's Guide To Selecting An ETF Manager & 14 Destinations Where Retirees Thrive Abroad