
Correlations largely determine the benefits of diversification. The lower the correlation between assets, the better the diversification. It is common practice in finance to measure correlations using short-term returns. In this post, we investigate how correlations—and therefore our understanding of long-term diversification benefits—change when we measure correlations using long-term returns.
Moving from monthly returns to rolling multiyear period returns reveals that correlations and betas between some assets change meaningfully over time. We demonstrate that correlations between international stock markets decrease as the return time horizon lengthens, implying that international diversification is more beneficial to long-term investors than conventional analysis suggests. Furthermore, some industries, particularly commodity producers, exhibit drastically decreasing correlations with the market and other industries over time. This suggests significant long-term diversification opportunities in overweighting industries with low or even negative long-term correlations and betas with other industries and the market. Finally, we demonstrate that REITs also exhibit a property where their initially high correlation with the stock market decreases significantly over time, while their correlation with direct real estate increases.
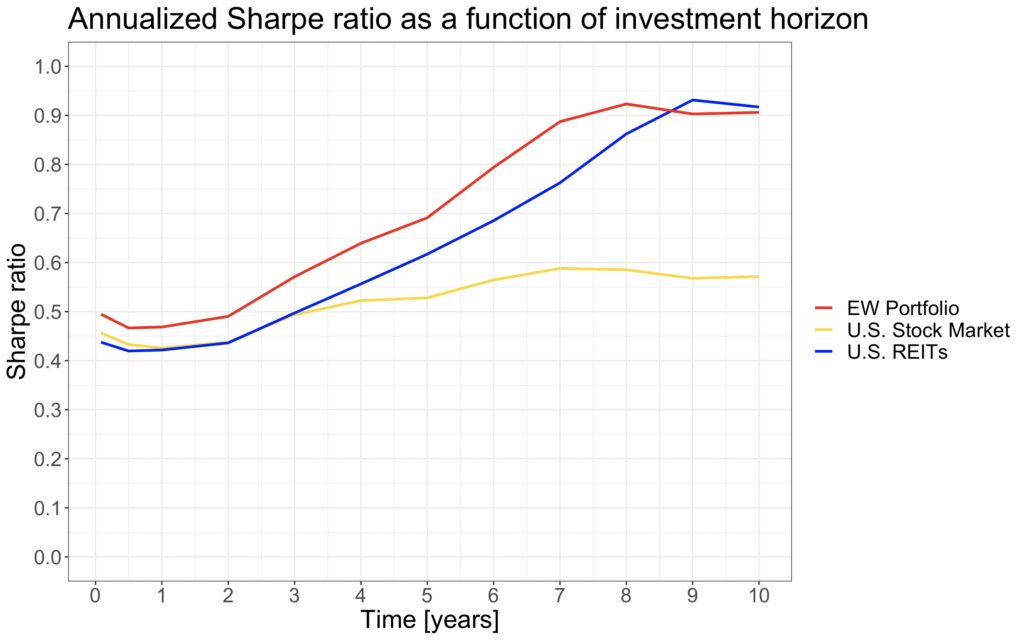
As a consequence, a portfolio with global diversification, a potential overweight in selected industries like commodity producers, and the inclusion of REITs has the potential to significantly lower volatility when measured using long-term returns. This implies a potential to meaningfully increase Sharpe ratios based on long-term returns compared to conventional analysis utilizing daily or monthly returns.
Long-run correlations among global stock markets
Asness, Israelov & Liew show in their paper International Diversification Works (Eventually) [1] that country-level stock market return variance can be decomposed into global and local multiple expansion and economic performance factors. The effect of these factors is not constant over time. Multiple expansion (particularly global multiple expansion) explains most of the country-level return variance in the short term, but as the time horizon lengthens, country-specific economic performance starts to dominate.
Given the results by Asness, Israelov, and Liew, we have reason to believe that long-run correlations among international stock markets should decrease over time, implying that risk-adjusted returns (measured, for example, by the Sharpe ratio) should increase as the holding period lengthens.
We utilize international stock market data from Kenneth French’s data library [2] to test this hypothesis. The data spans from July 1990 to March 2024. We use excess returns (returns in USD in excess of monthly T-bill). While less than 34 years of data is admittedly not extensive for testing long-term returns, it should be sufficient to see if our hypothesis is supported. We use rolling metrics (returns, volatilities, correlations, and Sharpe ratios) in our calculations. In our data, North America comprises the U.S. and Canada, meaning it closely represents U.S. returns. ‘AP ex Japan’ refers to developed Asia Pacific excluding Japan, and ‘EM’ refers to emerging markets.
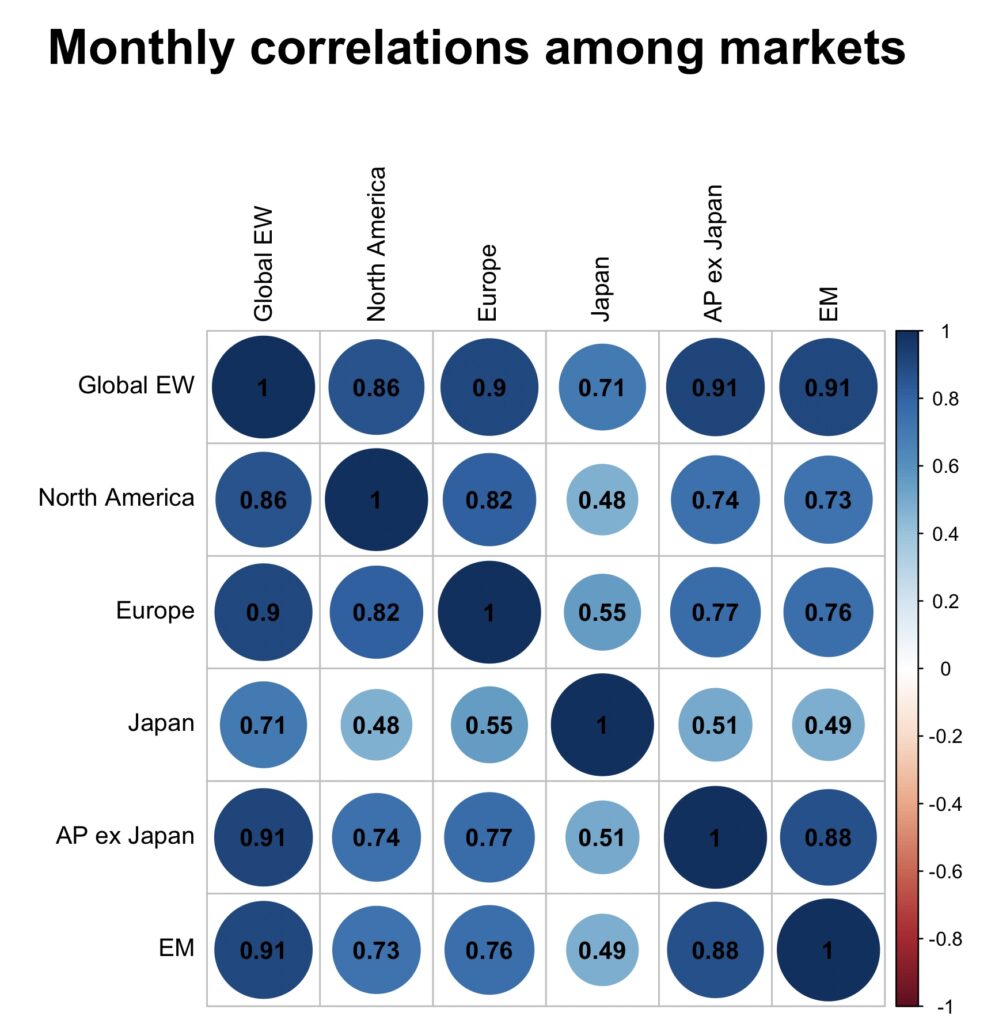
The figure below shows monthly correlations between different stock markets and correlations with monthly rebalanced equally weighted global portfolio. Apart from Japan (which has gone through very difficult times economically), monthly correlations are relatively high between international markets. This is why many people consider international diversification not that important.
But we aren’t really investing with a monthly horizon. Those with a long-term horizon may be better served by using long-term metrics. The next figure shows correlations using 5-year returns. Now, market-specific economic fundamentals start to have more of an effect, and we see correlations decreasing substantially.
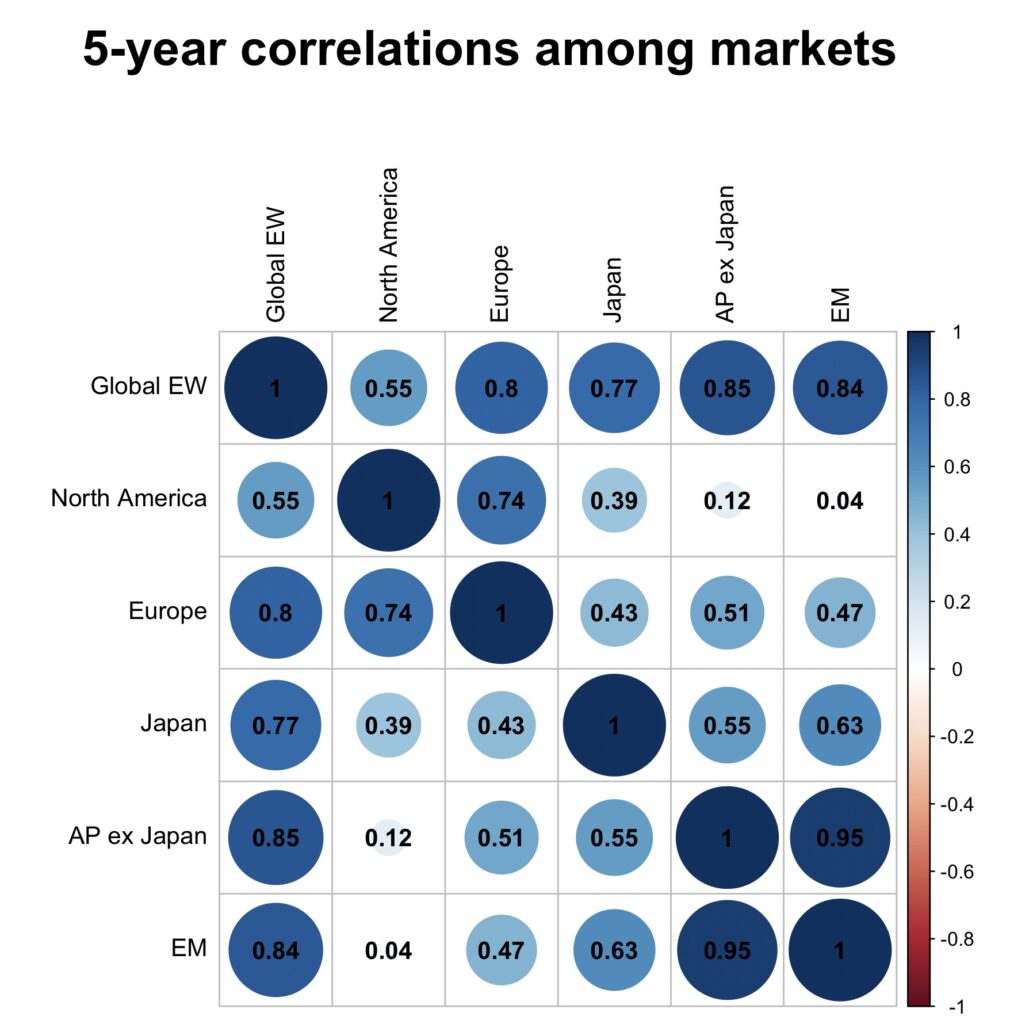
If we look at 10-year horizons, correlations have decreased further, and the correlation between North America and both developed Asia Pacific excluding Japan and emerging markets has even turned mildly negative. Interestingly, developed Asia Pacific excluding Japan and emerging markets have very high correlations both in the short and long term. This could be at least partly attributable to both having significant exposure to commodities. This suggests that investing in both developed Asia Pacific excluding Japan and emerging markets may not provide much diversification benefit.
The figure below shows how the average cross-correlation among international stock markets diminishes as the holding period lengthens. The average correlation in the short term is about 0.7, while it ranges between 0.5 and 0.3 for holding periods of five to ten years.

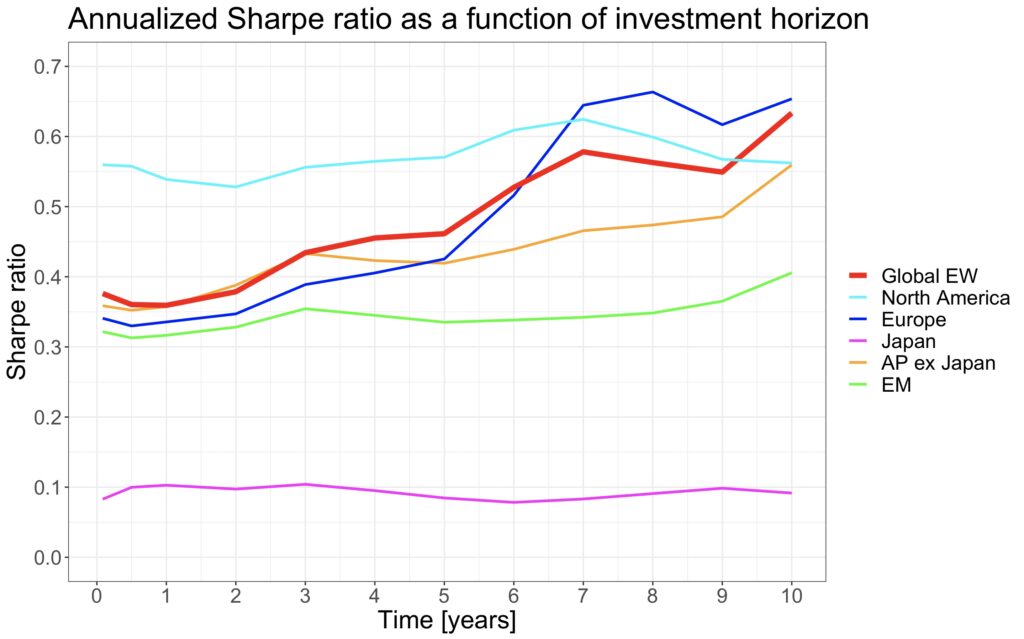
Arithmetic excess return remains relatively constant over time, but decreasing correlation reduces portfolio volatility for internationally diversified portfolios. This should lead to increasing Sharpe ratios for portfolios that are well diversified across different countries. The figure below shows that a globally equally weighted portfolio has a Sharpe ratio below 0.4 when measured using monthly returns, but the Sharpe ratio increases as the holding period lengthens, exceeding 0.6 when measured using ten-year returns. We see a similar pattern for the European Sharpe ratio, which could be related to the European market including many countries with idiosyncratic (country-specific) economic fundamentals that start to dominate correlations in the long run. The heterogeneity of economic fundamentals is a friend of a long-term diversifying investor. The decreasing correlations over time may explain why long-term stock returns are often said to be mean reverting.
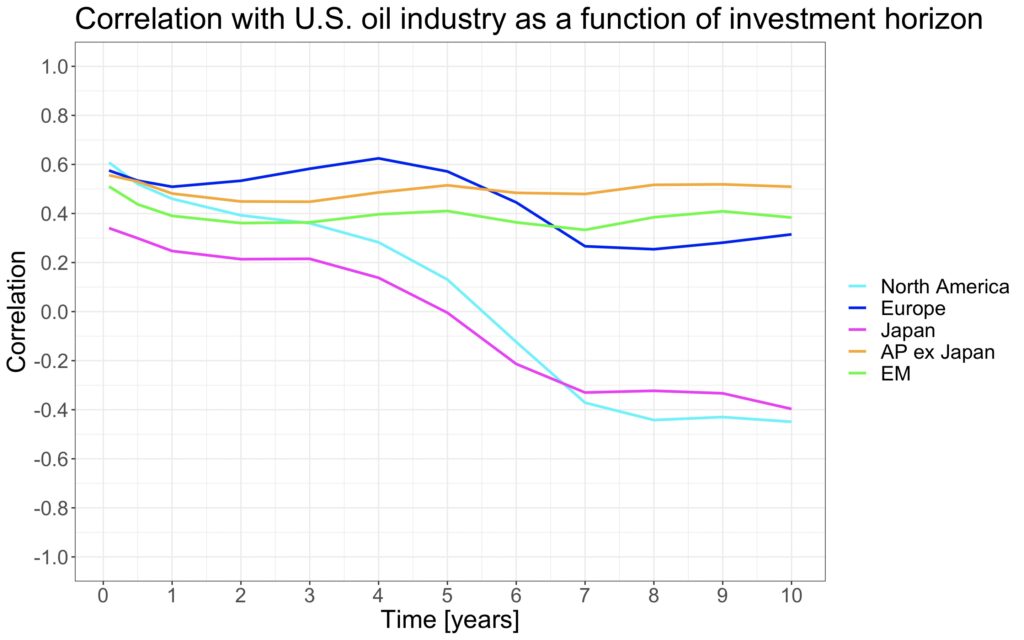
We can use the correlation with the U.S. oil industry to examine whether the commodity exposure of the developed Asia Pacific excluding Japan and emerging markets may explain some of the cross-correlations among international markets. From the next figure, we can observe that both of these regions maintain a correlation close to 0.5 with the U.S. oil industry over all measured holding periods. This suggests a relatively tight connection to commodities in terms of economic fundamentals.
On the other hand, both the Japanese and North American markets show a strongly decreasing correlation with the U.S. oil industry as the holding period lengthens. The correlation even turns negative after about five years. This observation may help explain why the correlation between the North American and developed Asia Pacific excluding Japan and emerging markets decreases over time and eventually becomes negative.
Long-run correlations among U.S. industries
White & Grantham from GMO, in their paper An Investment Only a Mother Could Love: The Case for Natural Resource Equities [3], demonstrate how natural resource equities have been excellent diversifiers in the long run. They show that oil, gas, and industrial metal companies in the U.S. have had relatively high correlations with the stock market in the short run, but low and even negative correlations in the long run. In addition to the long-term diversification benefit, they highlight how resource equities have, on average, had relatively high returns during periods of high inflation, providing much-needed protection from inflation shocks. The authors hypothesize that in the long term, high natural resource prices are a drag on the overall economy, while low energy prices may provide a boost, explaining why the long-term correlation between commodity producers and the overall stock market can turn negative when the time horizon exceeds five years.
We will test how the correlation between U.S. industry excess returns and stock market excess returns evolves as the time horizon increases. We utilize returns for 49 U.S. industries from Kenneth French’s data library [2]. Our monthly return data spans from July 1969 to May 2022. We again use rolling data in our calculations.
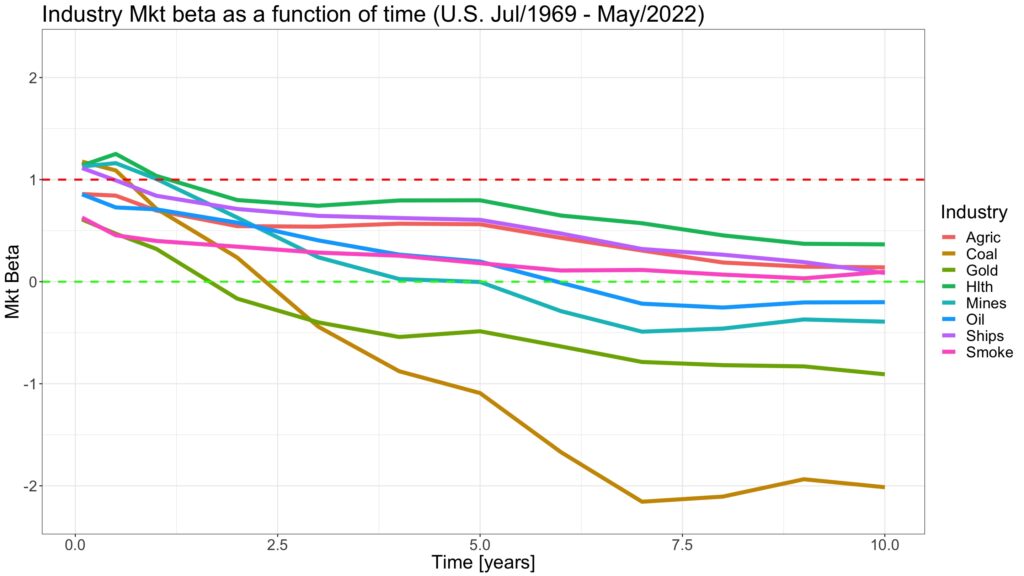
For most industries, the correlation with the stock market remains relatively constant over time. However, there are exceptions, and we have selected the eight industries with the lowest long-term correlations. All eight industries in the figure below have correlations lower than 0.25 with the stock market over a ten-year horizon. Coal, Gold, Mines, and Oil industries have negative long-term correlations with the stock market. Ships, Smoke, Agriculture, and Healthcare industries have long-term correlations with the stock market between 0 and 0.25.

Correlation alone does not determine how sensitive industry returns are to stock market returns. We need to incorporate standard deviations and utilize betas. The figure below shows that betas range from below 0.5 to -2. Notably, energy and metal companies have highly negative long-term stock market betas.
What about the cross-correlations among these low beta industries? The figure below shows the monthly correlation between each industry and the stock market. While the correlations are relatively low, they are not exceptionally low. Each industry typically has a correlation higher than 0.5 with the stock market.
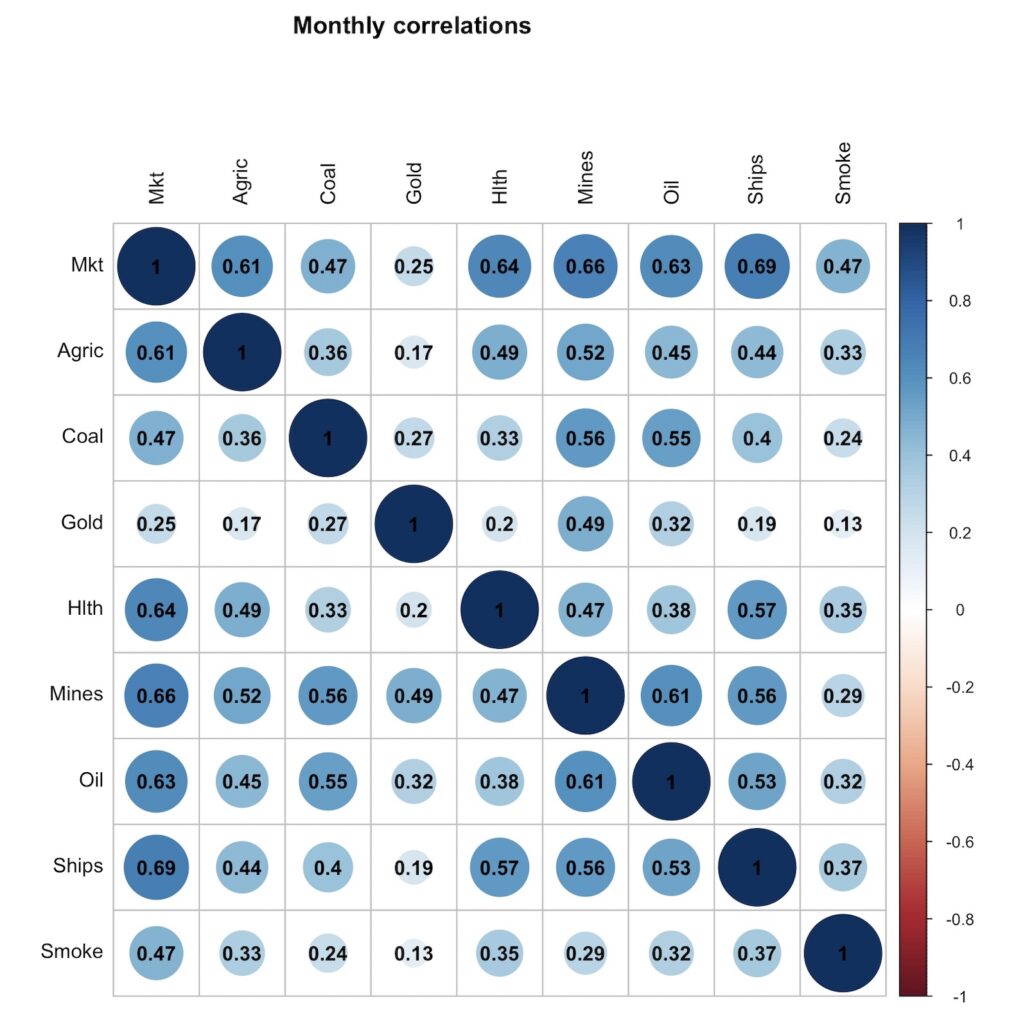
The next figure shows long-term (5-year) correlations. Now we see economic fundamentals taking over. The typical industry cross-correlation and the average correlation with the stock market are now close to zero. This indicates that the economic fundamentals of each industry differ significantly from each other and from the fundamentals of the overall stock market.
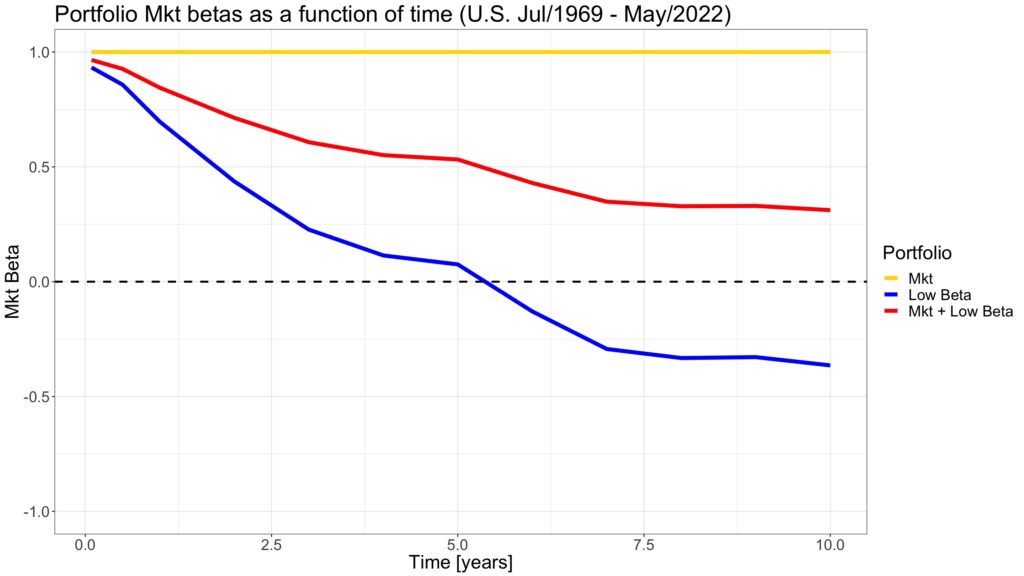
The next figure shows how the correlation with the stock market evolves as the time horizon lengthens. We have created a monthly rebalanced equally weighted portfolio of low beta industries ‘Low Beta’ and a monthly rebalanced equally weighted portfolio comprising 50% stock market and 50% low beta portfolio, labelled ‘Mkt + Low Beta’. The correlations of these portfolios with the stock market decreases as the time horizon lengthens. After approximately five years, the correlation between the low beta portfolio and the stock market becomes negative.

And the same expressed as stock market beta.
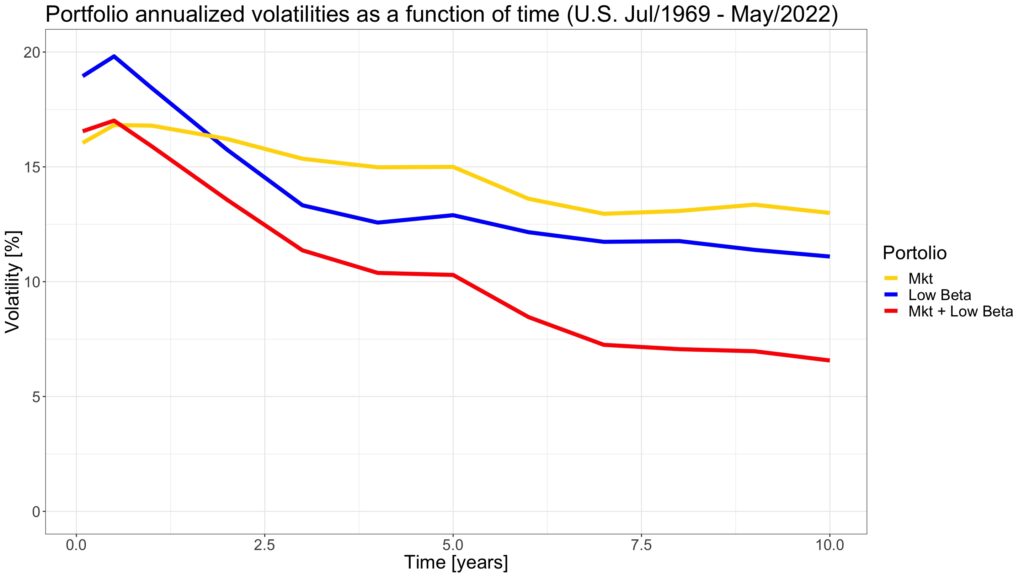
As industry cross-correlations decrease over longer time horizons, we should expect the annualized volatility of the low beta portfolio to decrease as well. The same applies to the annualized volatility of the equally weighted ‘Mkt + Low Beta’ portfolio. This is precisely what we observe in the figure below. In fact, as we demonstrated in my earlier article Time Diversification Works (Eventually), we should expect annualized sample volatility to decrease slightly in the long term simply because we have too few independent data points (approximately 5 at a 10-year horizon).
There is a reason why the formula for sample variance has ‘N – 1’ in the denominator. This adjustment compensates for the lack of sufficient data to avoid underestimating the true variance estimated from a small sample. While the annualized volatility of market returns is slightly decreasing over time, this is likely at least partly explained by the lack of independent data points.
However, the annualized volatility of the two other portfolios decreases much more rapidly, which we believe is largely explained by the decreasing correlations.
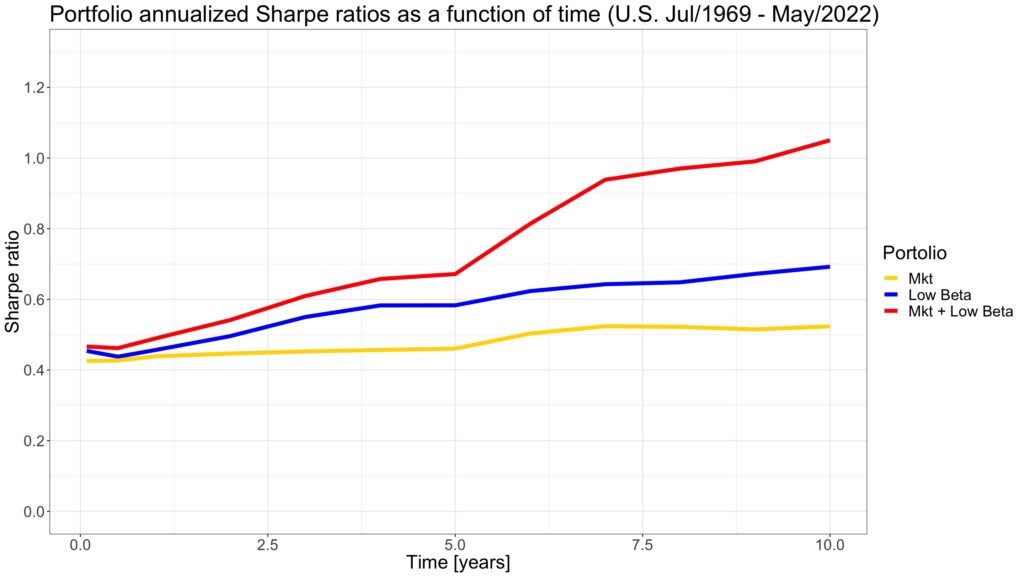
Annualized mean arithmetic excess returns remain relatively constant over time, while the annualized volatilities of both the low beta portfolio and the equally weighted ‘Mkt + Low Beta’ portfolio decrease. This should lead to increasing risk-adjusted returns in the long term, as reflected in the Sharpe ratios shown in the figure below. Specifically, the Sharpe ratio of the equally weighted ‘Mkt + Low Beta’ portfolio more than doubles as the time horizon increases from monthly to ten years.
What would be better for a long-term investor than an asset class providing equity risk premium with correlation properties akin to commodities? Historically, natural resource equities have proven to be just that. Offering equity-like returns, negative long-term correlation with the stock market, and strong performance during high inflation regimes.
Investing in commodities using futures provides similarly low correlation with the stock market even in the short term. However, commodity futures don’t provide an equity risk premium, meaning their expected return is much lower than that of natural resource equities.
Long-run correlation between U.S. stock market and REITs
Hoesli and Oikarinen, in their paper Does listed real estate behave like direct real estate? Updated and broader evidence [4], demonstrate that REITs also exhibit the property of having an initially high correlation with the stock market that significantly decreases over time. Simultaneously, their correlation with direct real estate increases. The authors use yearly panel data from six countries.
We test the long-term correlation properties between U.S. REITs and the U.S. stock market using monthly data from the FTSE Nareit All Equity REITs Index [5] and U.S. stock market data from Kenneth French’s data library [2]. The data spans from January 1972 to March 2024.
We again form an equally weighted portfolio, this time comprising 50% REITs and 50% U.S. stock market, and utilize excess returns (in excess of monthly T-bill rates). The portfolio is rebalanced monthly.
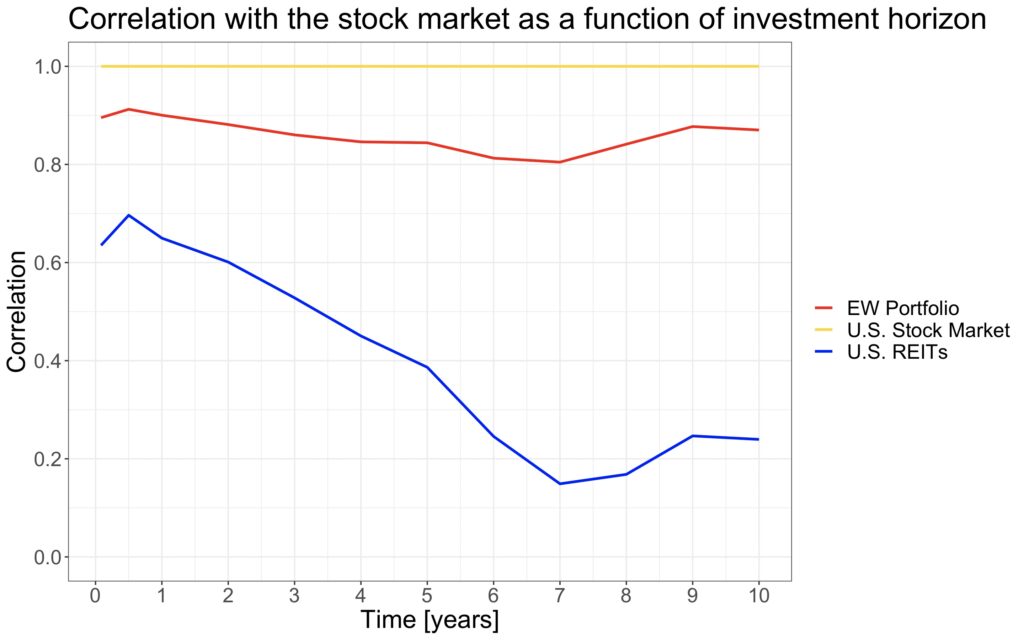
The figure below supports the findings of Hoesli and Oikarinen. The correlation between REITs and the stock market decreases substantially as the time horizon lengthens. REITs provide significant long-term diversification benefits for stock market investors and offer historical mean returns that are comparable to those of the stock market.
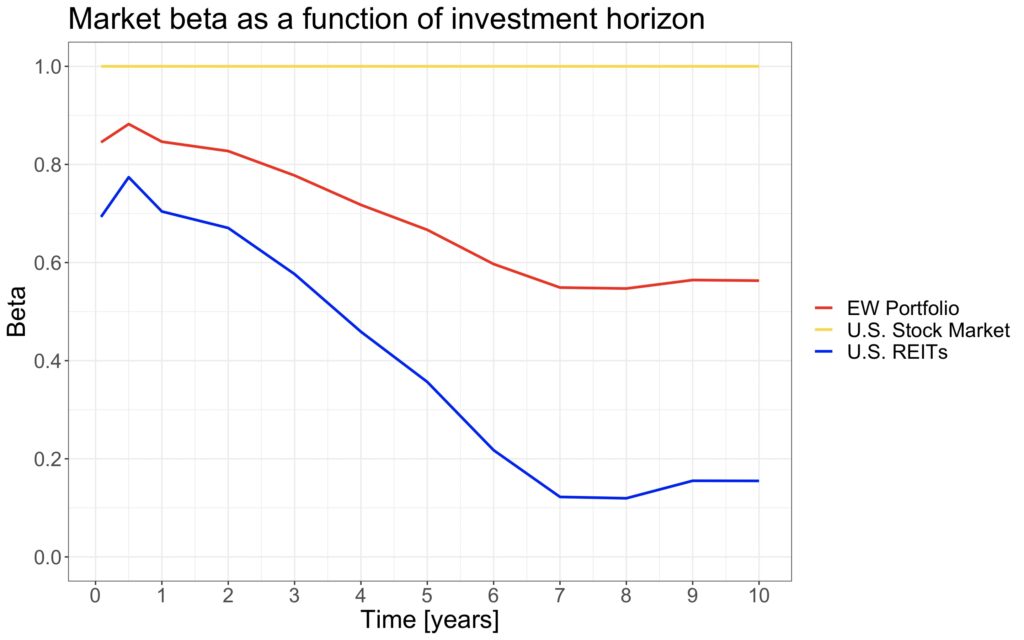
The long-term stock market beta of REITs decreases to close to zero.
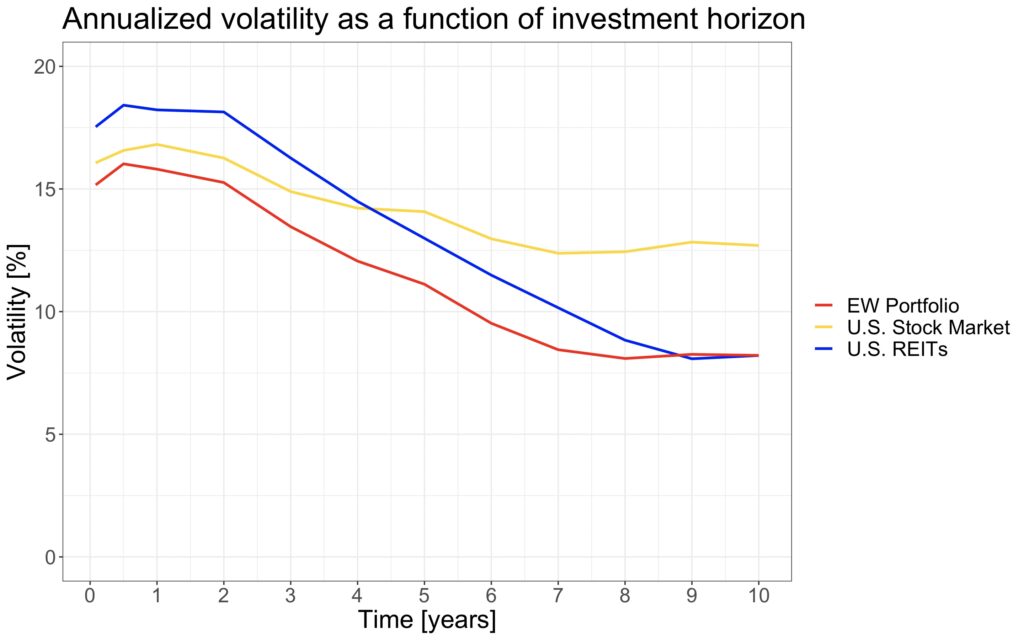
The volatility of both REITs and the equally weighted REITs and stock market portfolio decreases steeply as the time horizon lengthens. The fact that this happens to the REIT index suggests that the REIT sectors constituting the index may have significantly different economic fundamentals. These fundamentals begin to dominate internal cross-correlations in the long term, leading to decreasing REIT index volatility.
Decreasing volatilities of the REIT index and the equally weighted portfolio lead to increasing risk-adjusted returns. As the time horizon lengthens, this results in a steeply increasing Sharpe ratio for both the REIT index and, especially, the equally weighted REITs and stock market portfolio.
Conclusions and implications
Short-term correlations among global stocks, regardless of geography or sector, are dominated by valuation multiple changes. In the long term, economic fundamentals begin to dominate, leading to drastically lower correlations among international markets and sectors with unrelated economic fundamentals.
Correlations among international stock markets, with the exception of Asia Pacific excluding Japan and emerging markets, decrease significantly in the long term. This makes international diversification more important and beneficial in the long term than in the short term.
Some industries have unique long-term risk factors. An example of this is natural resource equities, which reflect the economic fundamentals of their underlying natural resources in the long term, as opposed to global and local valuation multiple changes in the short term. Allocating a meaningful portion of a portfolio to such sectors has provided significant diversification benefits for long-term investors. Additionally, natural resource equities tend to perform well in high inflation regimes, which is a valuable property for an asset class.
REITs have relatively high correlation with stocks in the short term, but their correlation with and sensitivity to stock market returns diminish substantially in the long term. This has provided an excellent diversification opportunity for REIT investors, who in the long term have been more exposed to the risks of direct real estate than to those of the stock market.
If you invest for the long term, selecting and assessing your portfolio based on short-term metrics may not be the best approach. Using long-term metrics in portfolio selection, such as when applying a mean variance optimizer (MVO), can lead to significantly different portfolio weights. If you mix assets like global stocks, natural resource equities, and REITs and input monthly parameters into MVO, your portfolio weights will be sensitive to small changes in the mean returns and volatilities you input because correlations are relatively high. In contrast, if you use long-term metrics, such as 3-year or 5-year returns, your correlations will be much lower. This leads to more robust (less sensitive to small changes in mean returns and volatilities) and more even portfolio weights, favoring a more diversified portfolio.
References
[1] Asness, C., Israelov, R. & Liew, J. M. (2011). International Diversification Works (Eventually)
[2] Kenneth French. ‘Developed Markets Factors and Returns’ & ‘Emerging Markets Factors and Returns’ & ‘Industry Portfolios’ Kenneth French data library
[3] White, L. & Grantham J. (2016). An Investment Only a Mother Could Love: The Case for Natural Resource Equities
[4] Hoesli M., Oikarinen E. (2021). Does listed real estate behave like direct real estate? Updated and broader evidence
[5] Nareit data, Monthly Historical Index Data: 1972 – 2023
Article by Markku Kurtti
excellent article, thanks
Thank you very much!
thank you for the article.
few questions on the back of an endless discussion that is taking place in a small corner of Italy, in particular on the benefits of EW vs Market Cap Weight.
A market Cap Weighted portfolio offers international diversification at 0 costs: no trading costs when rebalancing, no dealing with higher bid/ask spreads and higher costs for ETFs that invest in smaller countries. How much do you think this rebalancing costs would bring down the EW Sharpe?
Considering that now companies are more aware of where they want to be listed to attract more capital at a lower cost (i.e. non-US companies that are listed on the NYSE or Nasdaq), does the traditional country segmentation still make sense looking forward? (Appreciate that a non-US company is still considered as non-US but this matters when I go and see the actual ETFs I use to implement the strategy. ARM is a UK company but it is not included in the FTSE-whatever cause it is not listed in London and I can only invest in FTSE-linked products).
In the 34 years of the sample, 10 are the US mkt lost decade. A period that was not just bad for the US but great for EM. Isn’t the low correlation magnified by the chosen (available?) sample? Shouldn’t we expect correlations settle a bit higher in the future?
Thank you again for the great work you are doing!!!
I used EW portfolio to represent global diversification as it was the simplest way to demonstrate the effect of correlations. I don’t have a strong opinion whether we should use EW or market value weighted (VW) portfolios. I do believe EW provides better diversification but higher costs, as you mention. I don’t have a good estimate of how the costs may affect the Sharpe ratio of a EW portfolio.
I do believe the world has become more interconnected and that geographical borders don’t define a company, but on the other hand I do believe that local fundamentals will continue to play a role meaning that long term correlations will probably continue to be lower than short term correlations. This may hold better for smaller firms, which tend to have less international operations.
The fact that U.S had a particularly bad run while EM did well in my sample for sure will contribute to low long term correlation between the two. But I think this just underlines the fact that short term correlations will not determine long term correlations. I agree we probably shouldn’t expect zero long term correlation between the U.S. and EM going forward though. My sample is admittedly short, but the paper from AQR researchers I cited does have more data and seems to lead to similar conclusion.
“This suggests that investing in both developed Asia Pacific excluding Japan and emerging markets may not provide much diversification benefit.”
Unless I missed this part, Asia Pacific ex Japan and EM are highly correlated because there’s a lot of overlap between the two indexes. Asia Pacific ex Japan is primarily composed of China and India, which are also the largest components in MSCI EM.
https://www.msci.com/www/index-factsheets/msci-ac-asia-pacific-ex-japan/08499694
https://www.msci.com/www/fact-sheet/msci-emerging-markets-index/07149641
More recent correlations are lower because China has been de-coupling from the rest of the world throughout COVID.
I am using Asia Pacific ex Japan data for developed markets from Kenneth French data library. It consists of Australia, Hong Kong, New Zealand & Singapore.
Ah okay I see. Thanks for the clarification.