
Why would a skilled stock picker ever invest in more than a few of her best ideas? Isn’t diversification for those who don’t know what they are doing? It makes sense to think that a skilled stock picker with limited resources will not be able to generate similar alpha with her 50 best ideas compared to 5 best ideas. There must be some alpha decay as diversification increases. But there is a flip side: concentration increases idiosyncratic variance causing idiosyncratic variance drag to portfolio’s expected growth rate. Concentrated stock picker needs skill merely to catch up with the expected growth rate of a fully diversified benchmark portfolio.
We will show that the required minimum amount of stock picking skill (measured as unlevered alpha) required to overcome the diversification advantage of a fully diversified benchmark can be attributed to two factors: 1) average idiosyncratic variance drag (diversification premium difference to benchmark) caused by higher volatility attributable to concentration and 2) consistency of the alpha returns attributable to stock picking skill.
We will see that the required minimum unlevered alpha, at a given level of diversification, is a function of investing style and stock allocation (leverage multiplier). Big stocks require less skill compared to small stocks and especially compared to micro-caps. Value stocks, profitable stocks and stocks with high momentum require less skill compared to their opposite styles. Leveraging increases the required minimum level of stock picking skill to overcome the diversification advantage of the benchmark in direct proportion to leverage multiplier.
What counts as stock picking skill?
We define stock picking skill (unlevered alpha) as average arithmetic rate of return in excess of average arithmetic rate of benchmark return at 100% stock allocation. We assume that benchmark beta equals one for each portfolio, implying alpha is simply the mean of portfolio returns in excess of benchmark returns. We assume alpha returns are uncorrelated with benchmark returns and – to have alpha capture pure stock picking or timing skill – we further assume that alpha is uncorrelated with other know factors (value, momentum, low volatility etc.). In other words, alpha is the mean of firm specific (idiosyncratic) returns, which are not explained by known factors.
We use unlevered alpha (alpha at 100% stock allocation) to describe skill. This means we don’t count return obtained by simply leveraging unlevered alpha as skill. When we say alpha, we mean unlevered alpha unless otherwise stated.
Stock picking skill is about exploiting firm specific factors to select and time stocks with higher arithmetic expected return compared to benchmark. As stock picker exploits firm specific factors, we can think of idiosyncratic variance as a measure of magnitude of opportunity. Simultaneously, idiosyncratic variance is a measure of size of variance drag, which will decrease geometric expected return of a portfolio. Idiosyncratic variance is both an opportunity and a drag. In addition to increased volatility, the risk associated with portfolio concentration stems from the fact that opportunity can be converted to alpha only if one possesses genuine stock picking skill while variance drag converts to lower growth rate with mathematical certainty.
Our baseline assumption is that volatility of portfolio returns (excluding potential variance of alpha returns) is determined by benchmark’s systematic volatility and idiosyncratic volatility, which are uncorrelated to each other. We assume that idiosyncratic volatility is determined solely by the size (number of stocks in portfolio) of an equally weighted portfolio and idiosyncratic volatility of a single stock. Any variance of the stock picking skill (unlevered alpha) itself will add to portfolio variance and will therefore increase variance drag and decrease expected growth rate.
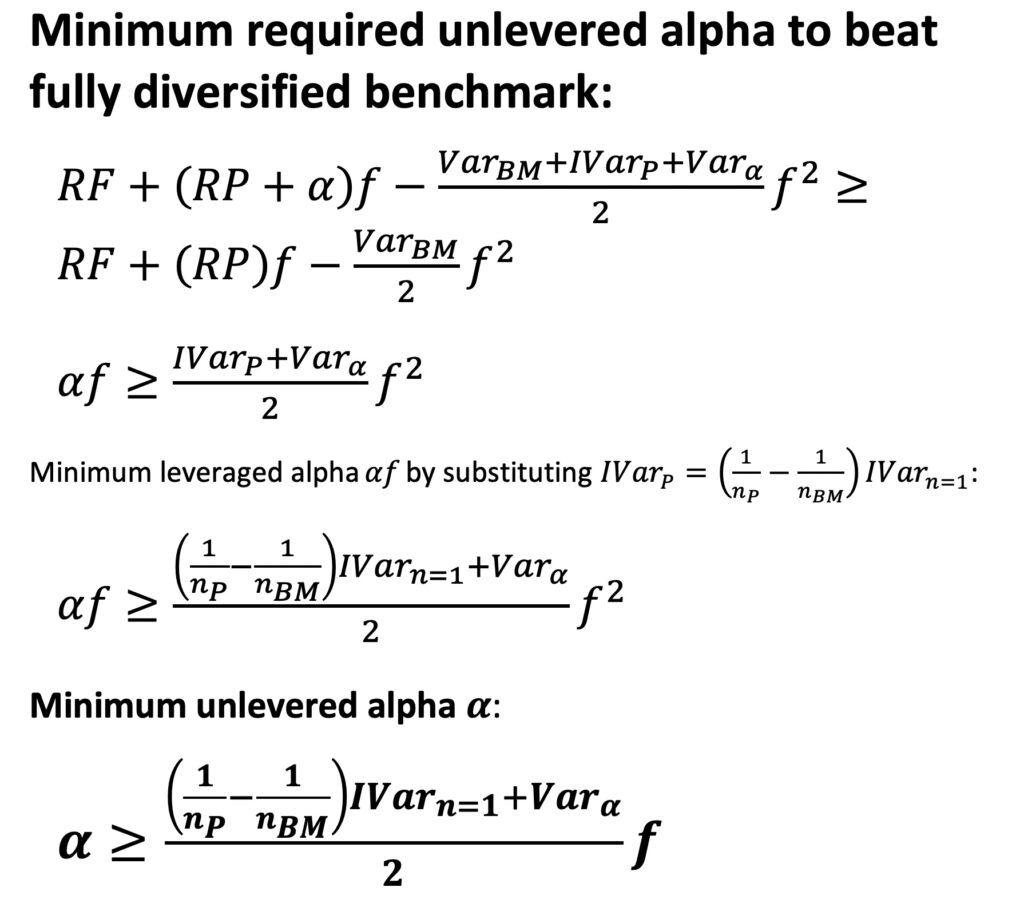
Minimum required unlevered alpha to beat expected geometric growth rate of a fully diversified benchmark is determined by two main components: 1) Idiosyncratic variance drag (the magnitude of diversification premium difference to benchmark) attributable to portfolio concentration and 2) the consistency of the skill over time (the variance of the alpha returns over time, which contributes to variance drag of the portfolio).
The math of minimum required unlevered alpha
We derive minimum required unlevered alpha below. Our method is simply finding out when the expected geometric growth rate of a less than perfectly diversified portfolio with alpha is greater than or equal to expected geometric growth rate of a fully diversified benchmark portfolio. We solve for unlevered alpha. All returns are in continuously compounded format.
Variance drag is equal to portfolio variance divided by two and is scaled by the square of leverage multiplier, which is reflected in the minimum required unlevered alpha formula below. The formula works for equally weighted portfolios.
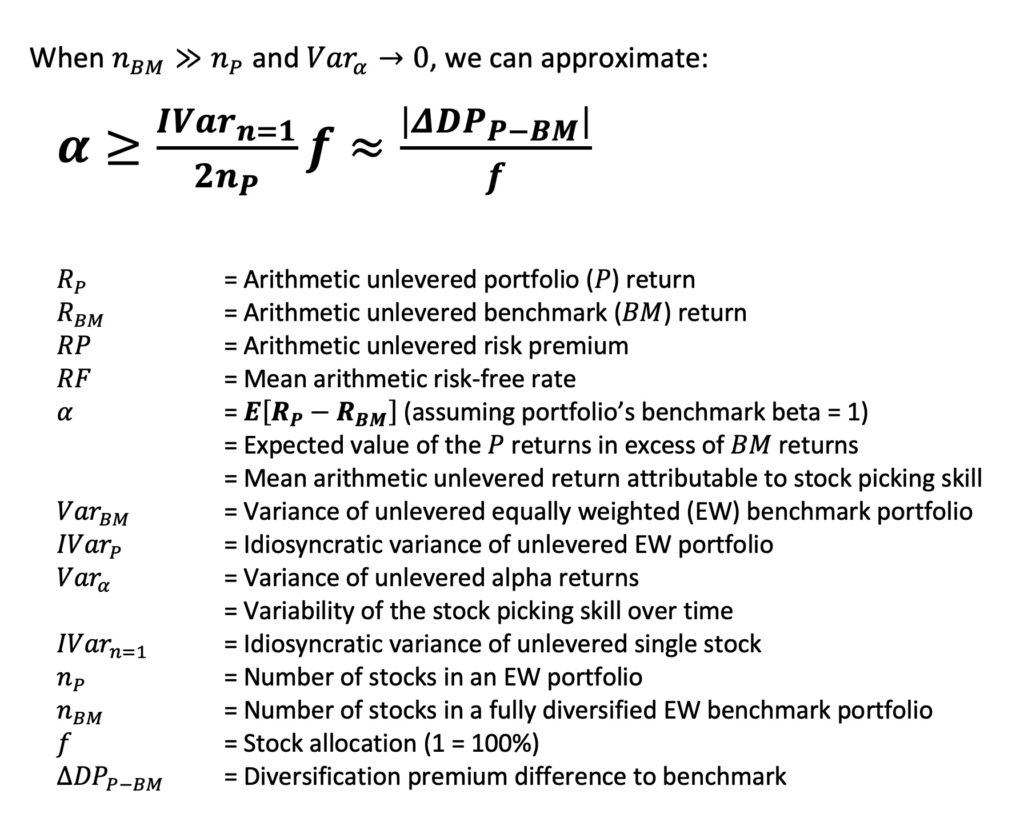
If we simplify and assume that the number of stocks in the benchmark is much higher than in our portfolio, and that our stock picking skill is perfectly consistent (zero variability over time), we can use an approximate formula shown below.
The concept of diversification premium difference to benchmark was introduced in my earlier article, Diversification is a negative price lunch. Diversification premium difference to benchmark is essentially an idiosyncratic variance drag of a portfolio, which is a function of number of stocks in portfolio and in benchmark, idiosyncratic variance of a single stock in benchmark portfolio and stock allocation (or leverage multiplier). When stock picking skill is perfectly consistent, the magnitude of diversification premium difference to benchmark divided by leverage multiplier approximates the required minimum required stock picking skill to beat a fully diversified portfolio. Approximation is very accurate when portfolio size is much smaller compared to benchmark portfolio size.
The importance of consistency
The fact that we are interested in expected geometric return means that it is not only the average size (alpha) of the excess returns attributable to stock picking skill, but also the consistency of the stock picking skill over time that matters. It is safe to assume that investors will not bring their A-game day in, day out. Stock picking skill may benefit from certain market conditions and be less well suited to others. Personal circumstances change over time and can affect the level of alpha. As a consequence, the expected value of the excess return over the benchmark attributable to stock picking skill must be time varying to some degree.
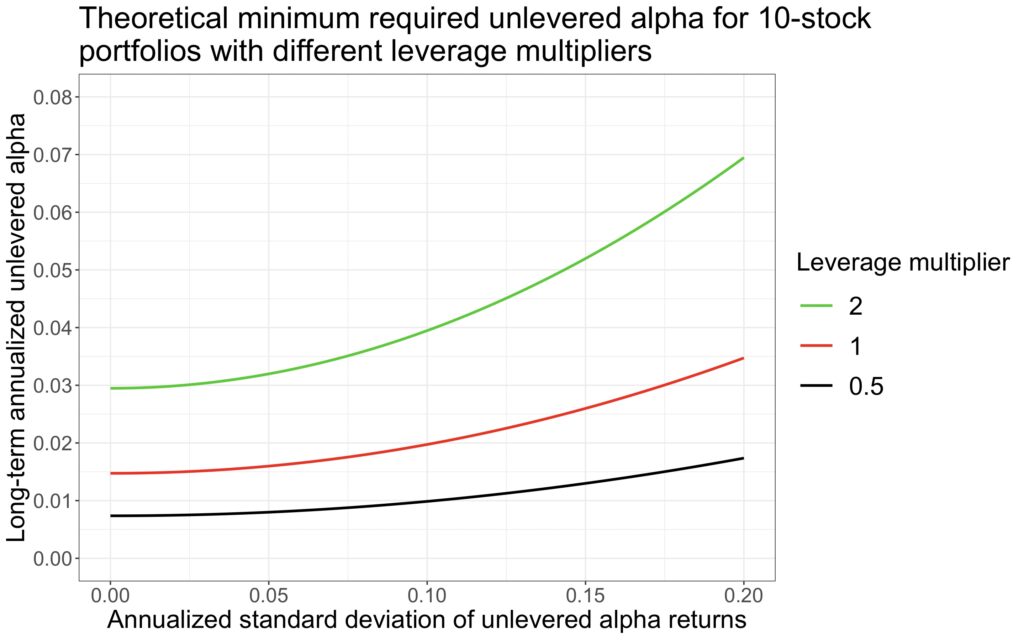
Let’s demonstrate the effect of lack of stock picking skill consistency. Theoretical required minimum alpha for equally weighted 10-stock portfolios is shown as a function of standard deviation of unlevered alpha returns in the figure below. Parameters are from empirical U.S. CRSP data (all common stocks from Jan-1973 to Jun-2018). Notice that most of the stocks in this data are micro-caps, which explains the high idiosyncratic variance (0.2953) of a single stock, which leads to relatively high alpha requirement (about 1.5 percentage points per year for unlevered portfolio with perfectly consistent stock picking skill over time).
It is difficult to say what would be a realistic range for standard deviation of unlevered alpha returns, but we can use the figure below for demonstration. We can see how the alpha requirement increases as stock picking skill gets less consistent. This is not a big problem if stock allocation is low, say 50%. But as stock allocation and inconsistency of the stock picking skill increases, we can see that it becomes increasingly more difficult to overcome idiosyncratic variance drag by stock picking skill.
Practical implication is that it is very difficult to compete against diversified leveraged portfolios or instruments with concentrated (equally) leveraged stock portfolios even if you are a highly skilled stock picker. And this is especially true if your outperformance tends to vary a lot over time.
We use simple simulation to verify our formula. In the simulation we create 500 000 years worth of random equally weighted 10-stock portfolio daily returns per each annualized standard deviation of unlevered alpha returns. Returns are drawn from normal distribution. We then draw the same amount of alpha returns using our equation to determine the mean of the distribution (unlevered alpha) and using desired standard deviation. We sum the daily returns of the randomly selected 10-stock portfolio together with the alpha returns and calculate the mean geometric growth rate of the portfolio. This mean growth rate is finally subtracted from the mean geometric growth rate of a fully diversified benchmark portfolio. If our equation works, we expect the result to be zero. We can see from the figure below that the deviation from theoretical expectation converges towards zero meaning that our equation seems to work.

Minimum required unlevered alpha for big, small and micro-caps
From now on we will assume that investor has perfectly consistent stock picking skill meaning that variance of alpha returns is zero. This is a generous assumption, but helps us to focus on the effect of idiosyncratic variance drag attributable to portfolio concentration.
The table below shows the parameters for different investing styles (different benchmarks) obtained from empirical U.S. stock market monthly return sample (all common stocks in CRSP data between Jan-1973 and Jun-2018). All portfolios (including benchmarks) are equally weighted. Equal weighting means that the results including all stocks are dominated by micro-caps. Last column shows the idiosyncratic variance of a single stock for each benchmark (style). Idiosyncratic variance of a single stock (together with number of stocks in the portfolio) is the most important determinant of the hurdle rate which alpha return must overcome. The details of the method how idiosyncratic variance of a single stock is measured can be found in section 3.3.2 in my thesis [1].
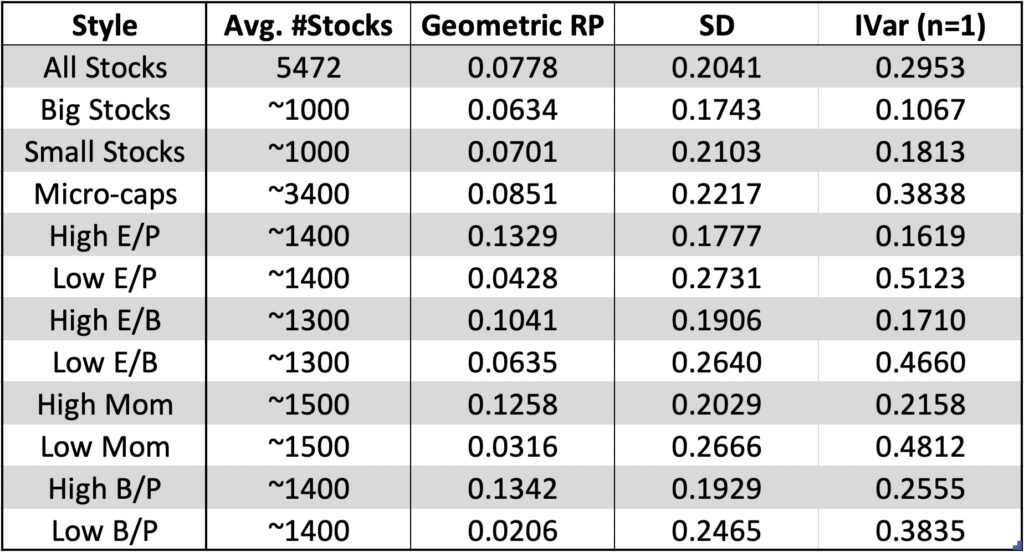
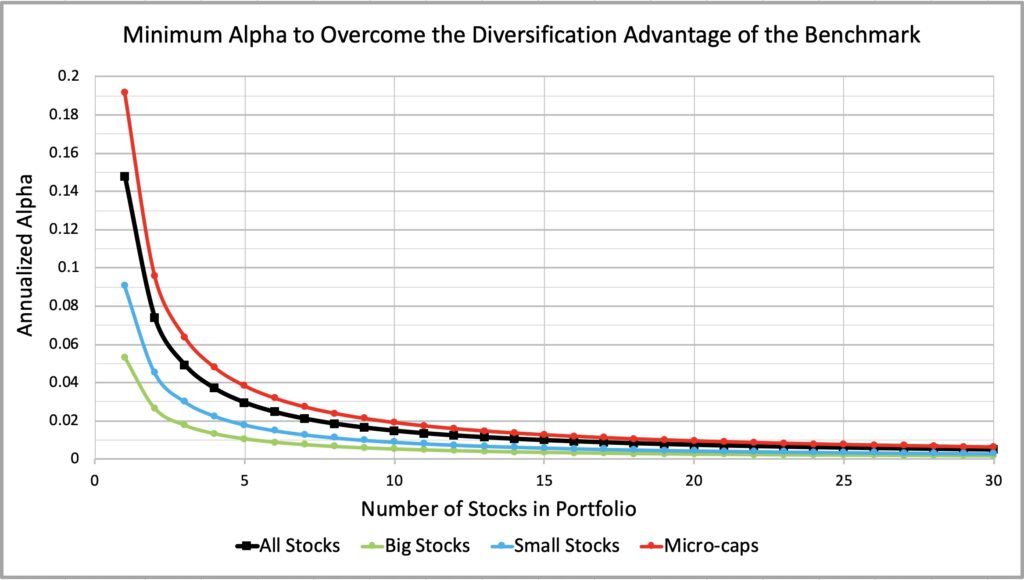
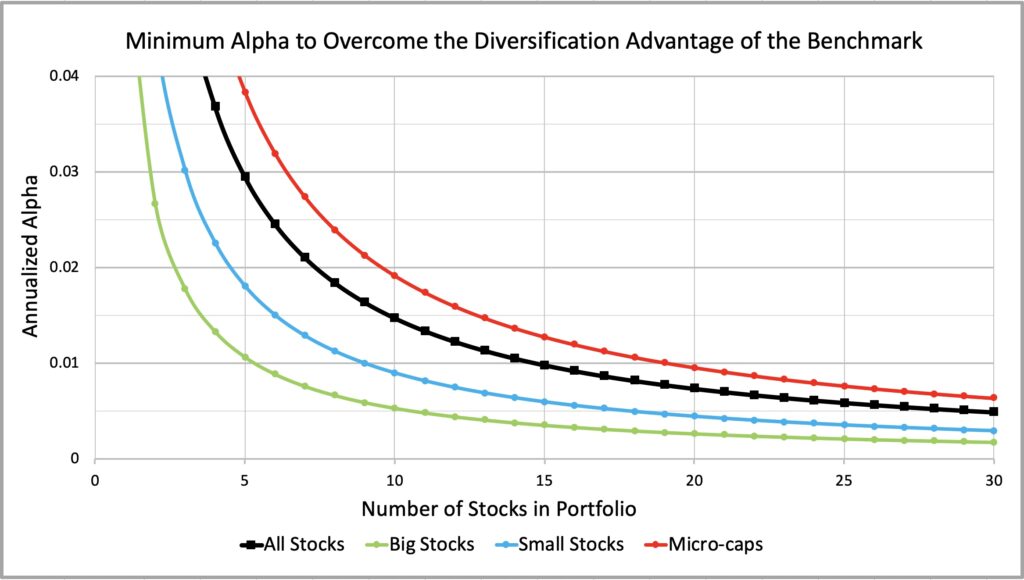
The figure below (and zoomed figure right after) shows the minimum required unlevered alpha for all stocks, big stocks (stocks above NYSE stock 50th percentile break point), small stocks (stocks between NYSE stock 50th and 20thpercentile) and micro-caps (stocks below NYSE stock 20th percentile).
We can see that the minimum required alpha for all stocks is close to micro-caps. Comparing big, small and micro-caps, we can roughly say that small stocks require two times and micro-caps four times more skill to overcome the diversification advantage of the benchmark compared to big stocks. Of course, fully diversified equally weighted illiquid micro-cap portfolio may not be implementable in reality, but we get the idea that concentration comes with a cost especially in the micro-cap space.
As an example, 10-stock portfolio consisting of big stocks requires about 0.5 percentage point (pp) alpha return to overcome the variance drag disadvantage compared to fully diversified benchmark. In small stocks universe close to 1pp is required and in the micro-caps about 2pp. Smaller firms may be less efficiently priced and may therefore offer higher alpha opportunities, but you need more alpha just to overcome the higher idiosyncratic variance drag to beat your diversified benchmark. No free lunch there.
Alpha requirement for single stock investors is astronomical. We can safely assume that luck plays a role for most highly successful single stock investors.
As the number of stocks increases, the alpha requirement decreases quickly. It is tempting to interpret that diversification is not important after a handful or couple of dozen names. This, however, is a fallacy in the long run as we demonstrated in my previous post Compounding materializes the importance of diversification. Concentration increases idiosyncratic variance, which decreases expected growth rate. In the long run, growth rate distribution converges towards expected growth rate implying time is an enemy of concentrated investor without skill. Concentrated investor with sufficient skill can turn expected growth rate difference to benchmark to his favour and make time his ally.
Minimum required unlevered alpha for leveraged portfolios
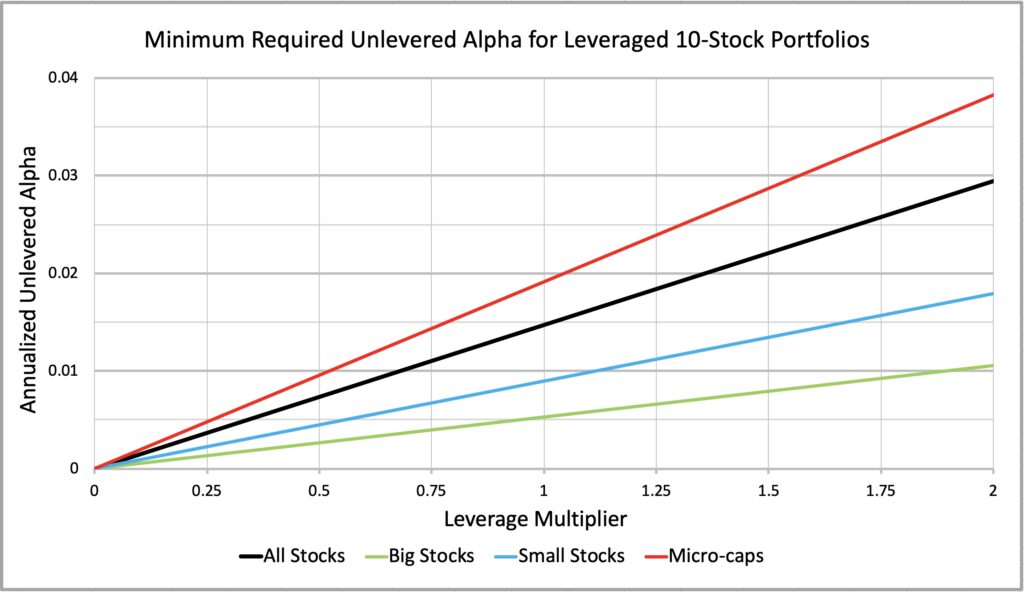
Minimum required amount of skill (unlevered alpha) to overcome benchmark diversification advantage increases in direct proportion to increase in leverage multiplier.
In the figure below, unlevered alpha requirement is doubled as leverage multiplier is doubled. A practical implication is that it is increasingly difficult, and eventually practically impossible, to beat a diversified benchmark with concentrated portfolio as leverage increases (both your portfolio and benchmark portfolio are leveraged equally). On the flip side, unlevered alpha requirement decreases as allocation to stocks decreases.
Minimum required unlevered alpha for different investing styles
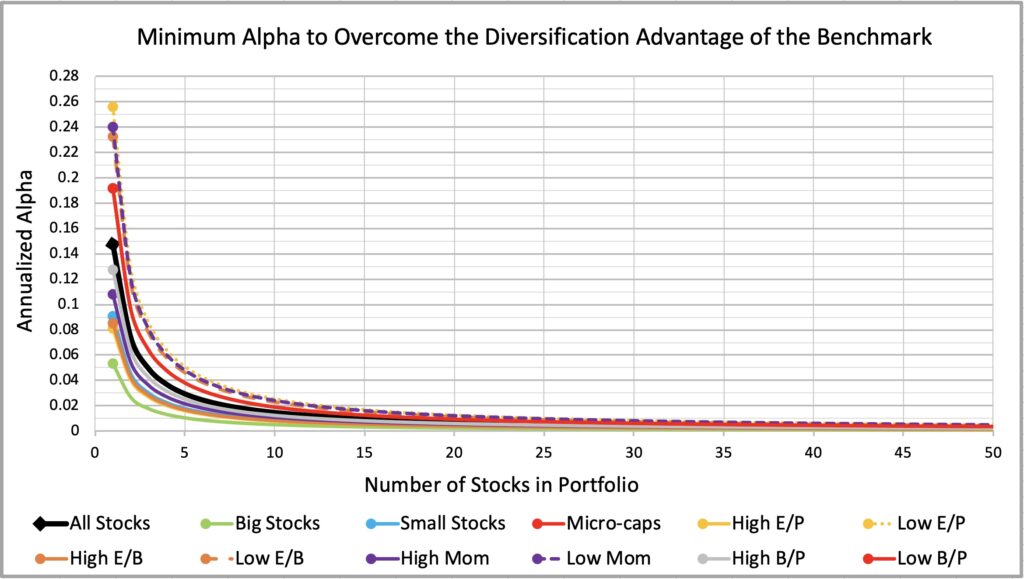
What about different investing styles apart from big, small and micro-caps? We have collected empirical parameters for several styles: high/low earnings yield (E/P), profitability (E/B), momentum (Mom) and book to price (B/P). Two figures below show that there is notable dispersion in minimum required unlevered alpha among investing styles.
High earnings yield, profitability, momentum and book to price have required considerably less skill to catch up with the diversified benchmark mean growth rate advantage compared to their opposite styles. For instance, 10-stock high E/P style has required about 0.8 percentage point (pp) alpha to overcome the idiosyncratic variance drag while low E/P style has required about 2.55pp alpha.
We define each of the high/low styles as 30% of the stocks with highest and lowest loading (based on ranking) to given style. For instance, high E/P style benchmark consists of 30% of the stocks with the highest earnings yield among all stocks. Momentum is measured as geometric growth rate in the past 12 months excluding previous month. All portfolios are equally weighted. More details about the styles can be found in section 5.8.2. in my thesis [1].
As we equal weight and most of the stocks are micro-caps, it means that micro-caps dominate our style returns. It is known that factors tend to be more pronounced among smaller stocks. We therefore can think of our style returns as style returns on steroids. We assume that the differences among big stocks would be smaller.
We have included two value styles: high E/P and high B/P. Pure Fama & French value (B/P) has higher idiosyncratic variance (higher minimum alpha requirement) compared to high E/P style. We can decompose E/P = (B/P)(E/B) implying that high earnings yield style is essentially pure value (B/P) combined with profitability (E/B) or “profitability at a reasonable price”. High and low profitability styles have particularly large difference between their idiosyncratic variances and when we combine profitability with pure value (which has lower idiosyncratic variance than growth), we end up with a pronounced idiosyncratic variance difference between high and low E/P styles.
Low E/P style, expensive firms (dominantly small firms in our data thanks to equal weighting) with low profitability, has the highest idiosyncratic variance among all tested styles. There are two sides to this: 1) low E/P style has the greatest idiosyncratic variance drag and hence the highest alpha requirement to overcome the expected growth rate advantage of the diversified benchmark and, on the flip side, 2) it provides the greatest opportunities for those equipped with genuine stock picking skill.
Stock picker needs to balance between the idiosyncratic variance drag (the negative), which is mitigated by increased diversification, and the alpha opportunity (the positive), which presumably too is mitigated by increased diversification. And of course, stock picker better have some idea of the expected benchmark return too (which historically has not been great for small low E/P stocks) as his stocks have exposure to style benchmark returns.

Geometric risk premiums and minimum required alphas
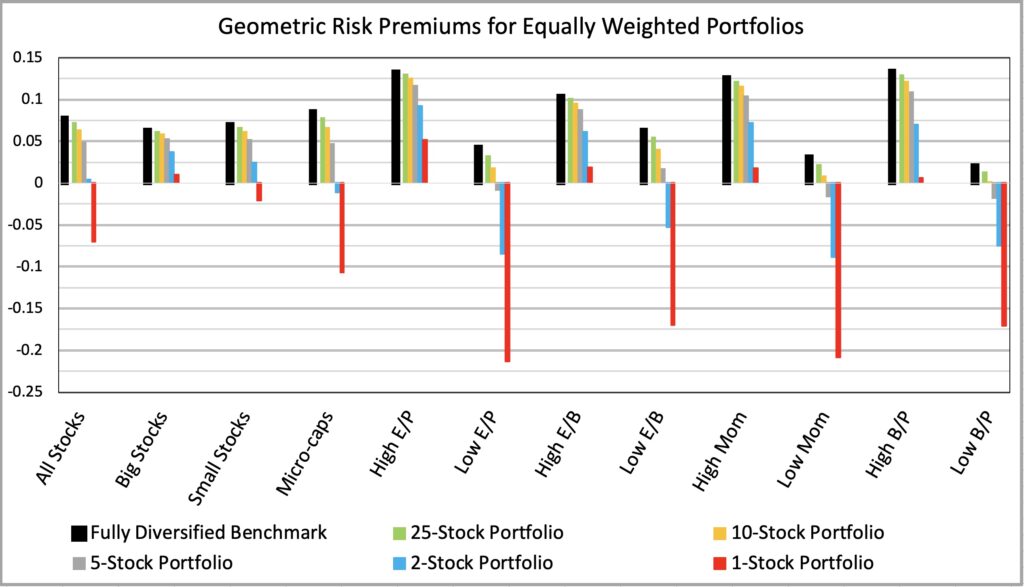
Bessembinder asks ”Do stocks outperform Treasury bills?” [2]. We might answer ”Depends on your investing style”. Geometric risk premium is the annualized expected (continuously compounded) geometric growth rate (or the 50thpercentile) in excess of annualized riskless rate (monthly T-bills). Figure below shows that the expected growth rate of single stock portfolios is lower than riskless rate for the ‘All Stocks’ category and for most styles, but not for big stocks, high earnings yield, high profitability, high momentum or Fama & French value styles. Geometric risk premium for different portfolio sizes is calculated by subtracting theoretical minimum required unlevered alpha from empirical geometric risk premium of a benchmark.
We use the same data as Bessembinder except that our period is shorter and on average includes more micro-caps, because Nasdaq (which is loaded with micro-caps) entered CRSP database starting from Jan-1973 (the start of our data and roughly the mid-point of Bessembinder data).
Our figure shows there are two important parameters for a stock picker to consider when choosing a style and the level of diversification: 1) expected (geometric) return of his investing style (benchmark) and 2) the idiosyncratic variance drag attributable to concentration.
If you choose a losing style, you give market a head start and even if you are skilled enough to overcome the idiosyncratic variance drag to beat your style benchmark, you may not beat a naïve equally weighted market portfolio. On the other hand, if you try to maximize your alpha and concentrate too much, you may achieve high alpha and still lose to your style benchmark (thanks to too high idiosyncratic variance drag) meaning you would have been better off simply owning your benchmark portfolio.
Warren Buffett talks about investing within your “circle of competence” meaning investing in the type of firms you understand and may have an edge on. This can lead to focusing on single investment style, which leaves investor exposed to style risk i.e. the risk that your style significantly underperforms the broad market in your investment horizon. Sticking to your circle of competence may enhance your alpha in relation to your style benchmark, but it certainly will shrink your opportunity set.
Effective diversification ideally includes diversification across different styles (factors). Diversification reduces risk (volatility), variance drag and – when diversifying across styles – the uncertainty related to expected return.
Here we show the minimum alpha requirement attributable to idiosyncratic variance drag (geometric risk premium of a benchmark minus geometric risk premium of a portfolio) for different styles and portfolio sizes.
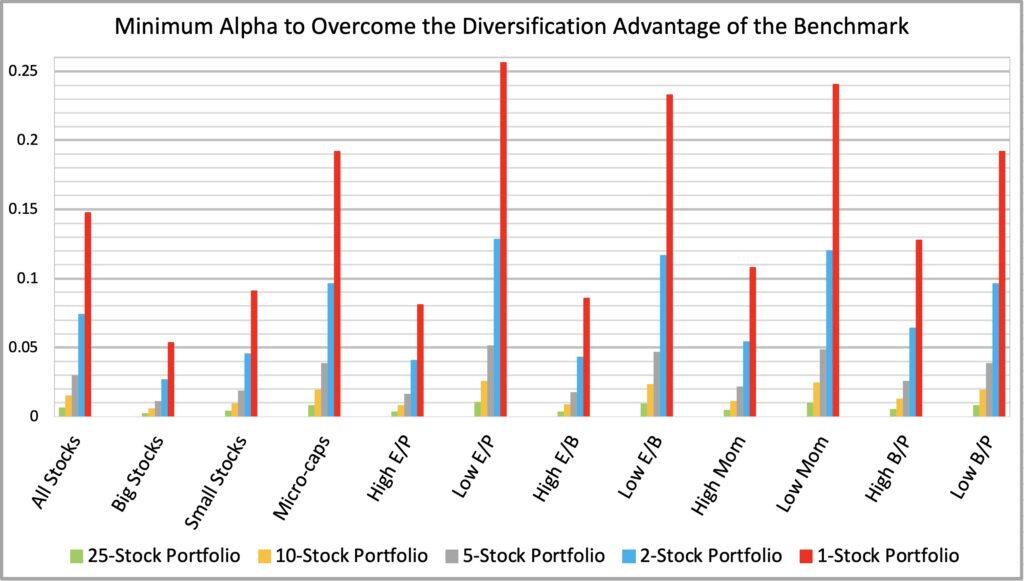
There appears to be a correlation between historical benchmark returns and idiosyncratic variance of a single stock. Excluding the size effect (big, small and micro-caps), the styles with lowest historical growth rates have had the highest idiosyncratic variances (highest minimum alpha requirements) and the styles with highest historical growth rates have had the lowest idiosyncratic variances.
One implication is that investors with e.g. high earnings yield style have earned returns which have been largely determined by their benchmark (style) returns even if they have had relatively concentrated portfolios. Returns for investors with concentrated low earnings yield style portfolios have been more dependent on security selection.
But why would styles with high idiosyncratic returns have low returns? One explanation could be so called lottery preference. Some investors may prefer stocks that may pay off big and this is exactly what idiosyncratic variance delivers: large dispersion of returns among individual stocks. Investors with lottery preference may bid up lottery stock prices leading to lower forward-looking returns.
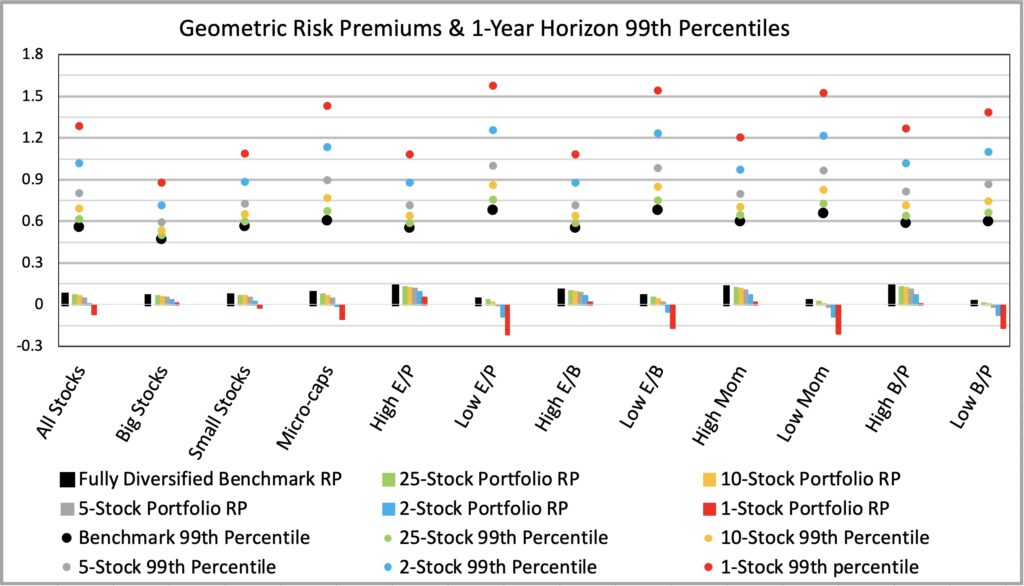
The figure below shows the historical geometric risk premiums for different styles and portfolio sizes and the best 1% (99th percentile) returns for one-year horizon. On average, the styles with highest idiosyncratic variances have the best 99th percentile outcomes. And this is particularly true for concentrated portfolios. It is easy to see why styles with high idiosyncratic variance may attract those who are drawn to lottery type of investments and, on the other hand, we can see that these styles provide the best short to medium term opportunities for those who have genuine stock picking skill.
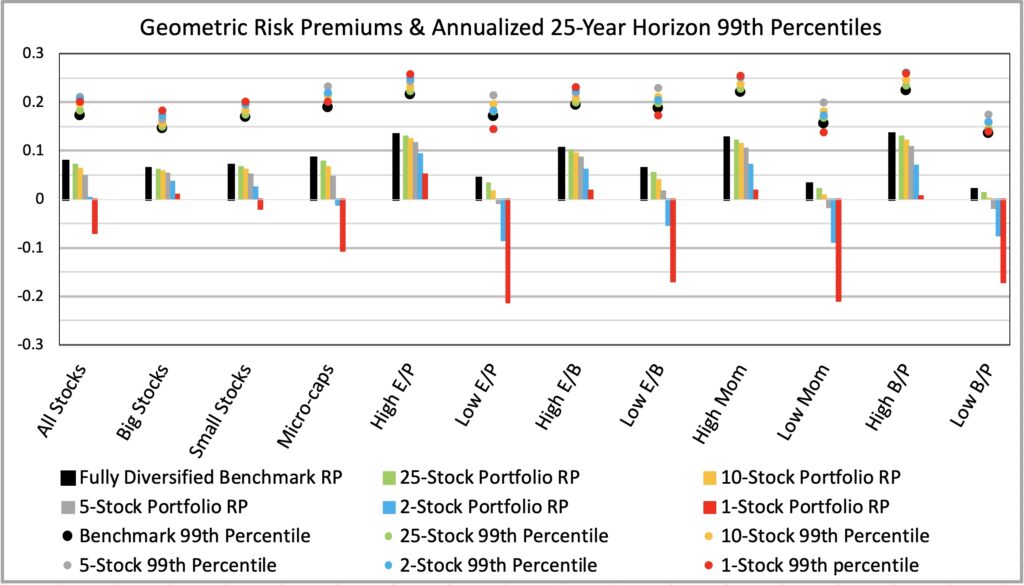
But concentration is risky. If you concentrate and don’t have genuine stock picking skill, time will be your enemy. The figure below shows that in a 25-year period even the 99th percentile outcomes start to converge towards geometric expected return. We can see that, with high idiosyncratic variance styles, best 99th percentile results now require some diversification and are achieved with 5-stock portfolios. Among styles, best 99th percentile outcomes are now achieved with high expected return styles, which typically have low idiosyncratic variance.
Predictability of expected return and idiosyncratic variance
Stock picker needs to select his circle of competence or investing style. This will determine the benchmark portfolio. As discussed, investing style selection is important as historically different styles have had both notable mean return and diversification premium (idiosyncratic variance drag) differences. Regardless the alpha a stock picker can generate, style return and variance drag will largely determine the return difference to naïve market portfolio.
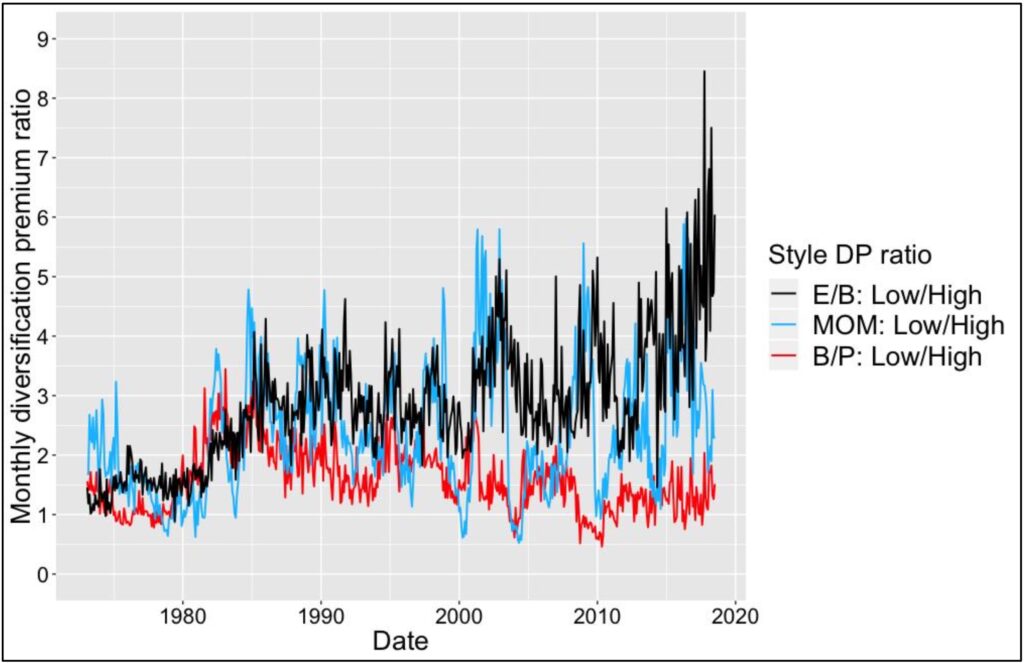
One aspect to consider is how easy or difficult it is to predict expected returns and idiosyncratic variances. We can test how reliable e.g. the month to month return differences and idiosyncratic variance differences have been between opposite styles. We use our empirical data and calculate monthly win rate for mean geometric return and diversification premium (idiosyncratic variance drag).
We measure diversification premium ratio, which e.g. for B/P means idiosyncratic variance drag of low B/P style divided by idiosyncratic variance drag of high B/P style. Diversification premium ratio is greater than one when diversification premium (idiosyncratic variance drag) of low B/P style (growth style) is higher. Diversification premium ratios (measured for each month) for three style pairs are shown in the figure below. The message of this figure is that idiosyncratic variance drag differences (when considering which, the low or high, style has higher idiosyncratic variance drag) between these style pairs are very consistent from month to month.
In our data, value (high B/P) has had higher return compared to growth (low B/P) in 61.7% of months, and value has had lower idiosyncratic variance drag compared to growth in 86.6% of months. Corresponding numbers for high versus low momentum are 65.2% and 92.5% and for high versus low profitability (E/B) 58.1% and 99.6%. Remarkably, there have been only 2 out of 546 months when low profitability style has had lower idiosyncratic variance drag compared to high profitability style.
Our take away is that idiosyncratic variance drag is much more predictable than expected return. More generally, it is easier to predict variance than mean return. It is therefore safer to diversify more as it will reliably bring down idiosyncratic variance drag compared to concentrating more in a hope of higher alpha.
Conclusions & Implications
It is possible to have genuine stock picking skill (measured as unlevered alpha), but still have lower expected portfolio growth rate compared to fully diversified benchmark portfolio.
Portfolio construction of a skilled stock picker is a compromise between enhancing alpha by concentration and mitigating idiosyncratic variance drag by diversification.
The more consistent the alpha is over time the better. Variance of the alpha returns adds to portfolio variance drag and decreases expected growth rate of the portfolio.
Required minimum unlevered alpha to overcome the diversification advantage (lower variance drag) of a diversified benchmark portfolio decreases approximately in direct proportion to increase in diversification and increases in direct proportion to increase in leverage multiplier.
Different investing styles have different idiosyncratic variances and therefore different requirements for minimum alpha to overcome benchmark diversification advantage. Smaller stocks require more alpha than bigger stocks and styles like low E/P, low E/B, low Mom & low B/P require considerably more alpha compared to their opposite styles.
Assuming perfectly consistent stock picking skill over time, 10-stock big stocks portfolio has historically required roughly 0.5 percentage point (pp) annualized alpha, small stocks ~1pp and micro-caps ~2pp. High E/P, E/B, Mom and B/P styles, in the universe of all stocks, have required roughly ~1pp and low E/P, E/B, Mom and B/P styles north of ~2pp. Low E/P style (smallish growth stocks with low profitability) have required the highest 2.55pp alpha.
Stock pickers often have a “circle of competence” meaning they have a certain investing style they focus on. Focusing on a single style exposes investor to style risk. This means that even if investor has stock picking skill and is able to beat his style benchmark, he may not beat a market portfolio if his style happens to underperform the market. Diversification across styles reduces this risk.
Idiosyncratic variance drag differences are easier to predict than expected return differences. It is therefore safer to increase diversification, which reliably decreases minimum alpha requirement, than to increase portfolio concentration to enhance uncertain alpha.
References
[1] Kurtti, M. T. (2020). How many stocks make a diversified portfolio in a continuous-time world?
- 3.3.2 Estimation of diversification premium & compensation of differences in monthly number of stocks
- 5.8.2 The effect of investing style
[2] Bessembinder, H. (2018). Do stocks outperform treasury bills?
Article by Markku Kurtti
This article offers a fascinating perspective on the subject. The depth of research and clarity in presentation make it a valuable read for anyone interested in this topic. It’s refreshing to see such well-articulated insights that not only inform but also provoke thoughtful discussion. I particularly appreciated the way the author connected various aspects to provide a comprehensive understanding. It’s clear that a lot of effort went into compiling this piece, and it certainly pays off. Looking forward to reading more from this author and hearing other readers’ thoughts. Keep up the excellent work!
Thank you, very much appreciated!
Pingback: "negatively priced lunch" - Party at the Moontower